
- Moving the markets
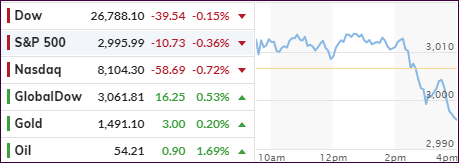
It sure was a day consisting of mixed reports and, as much as I searched, I could not find a reason that might have supported the early rally. Of course, the latest earnings reports took center stage, but it seemed the disappointing results from McDonalds, Travelers and UPS were overpowering the positive ones.
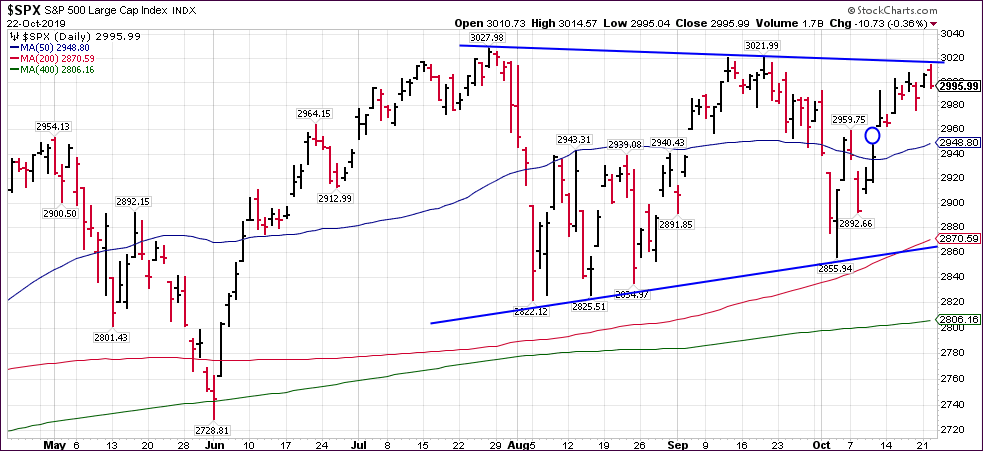
With the markets failing to break out, after having reached the upper limit of their 3-month trading range, this may change when tech behemoth Amazon releases its results on Thursday. Analysts are looking for “a solid beat” and a subsequent move of the major indexes not just above the current glass ceiling but also into new record-high territory.
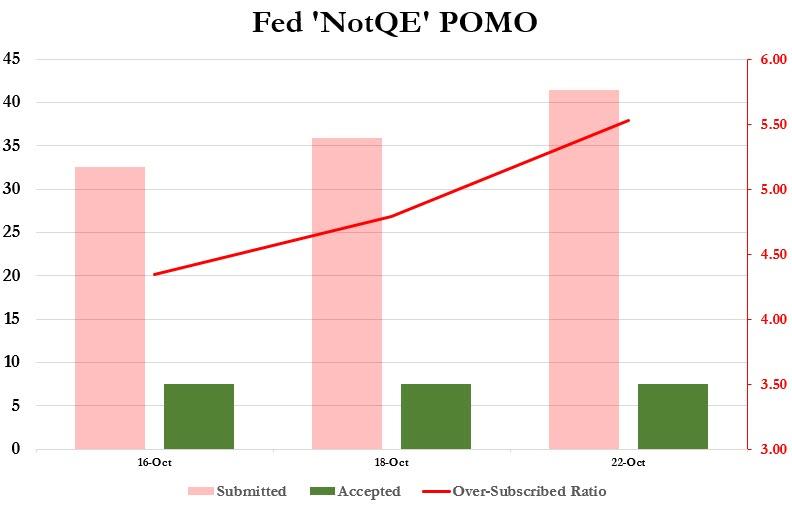
With traders’ focus being on a breakout, almost no one talks about far more concerning issues, namely the continued stress, strain and funding squeeze in the overnight lending markets (repos). It’s a very complex issue that boils down to the fact that banks have trouble securing funds due to a shortage in liquidity.
That makes me go hmmm… The Fed announced last week that they will inject funds at a rate of $60 billion per month (but they don’t call it QE) via the purchase of T-Bills, yet today’s repo was oversubscribed 5.5 times. This confirms that participants are scrambling to convert their “safe” assets into dollars as fast as possible, as ZH explains. That leaves this question:
Why are banks still so desperate for liquidity even though the Fed has now made clear the Fed’s balance sheet will expand to accommodate all reserve needs, and why do they so stubbornly refuse to approach the interbank market for their funding needs?
In short, what do they know about the banking system that we don’t?
This monetary crunch, if it continues, may very well get exponentially worse, at which time, there will be no way that the sleepy equity bulls will not have a very rude awakening.
The “smart money” may have already woken up to that fact, if this chart from Bloomberg is any indication.
2. ETFs in the Spotlight
In case you missed the announcement and description of this section, you can read it here again.
It features 10 broadly diversified and sector ETFs from my HighVolume list as posted every Saturday. Furthermore, they are screened for the lowest MaxDD% number meaning they have been showing better resistance to temporary sell offs than all others over the past year.
The below table simply demonstrates the magnitude with which some of the ETFs are fluctuating regarding their positions above or below their respective individual trend lines (%+/-M/A). A break below, represented by a negative number, shows weakness, while a break above, represented by a positive percentage, shows strength.
For hundreds of ETF choices, be sure to reference Thursday’s StatSheet.
For this current domestic “Buy” cycle, here’s how some our candidates have fared:
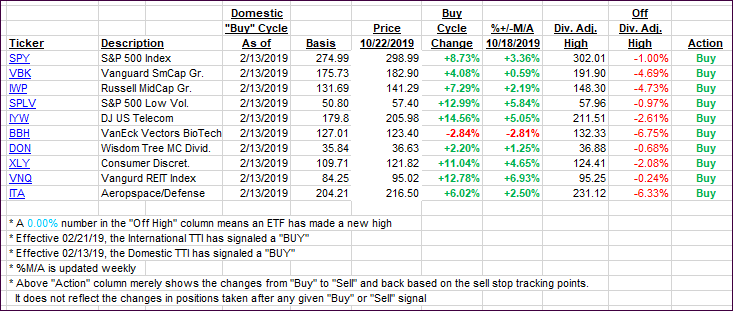
Again, the %+/-M/A column above shows the position of the various ETFs in relation to their respective long-term trend lines, while the trailing sell stops are being tracked in the “Off High” column. The “Action” column will signal a “Sell” once the -8% point has been taken out in the “Off High” column. For more volatile sector ETFs, the trigger point is -10%.
3. Trend Tracking Indexes (TTIs)
Our Trend Tracking Indexes (TTIs) barely changed as an early rally faded into the close.
Here’s how we closed 10/22/2019:
Domestic TTI: +3.58% above its M/A (prior close +3.57%)—Buy signal effective 02/13/2019
International TTI: +1.63% above its M/A (prior close +1.80%)—Sell signal effective 10/03/2019
Disclosure: I am obliged to inform you that I, as well as my advisory clients, own some of the ETFs listed in the above table. Furthermore, they do not represent a specific investment recommendation for you, they merely show which ETFs from the universe I track are falling within the specified guidelines.
Contact Ulli