
- Moving the markets
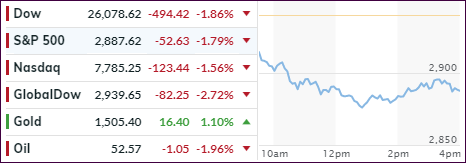
Yesterday’s sea of red worsened today, as absolutely no bullish sentiment was found anywhere, which had the major indexes heading sharply south in one of the worst starts to a quarter since 2008. The downside leader was Transportations, which are now down 5% so far this week.
In addition to Tuesday’s weak manufacturing report, traders now faced more pain in form of slower job creation with ADP’s employment gains simply collapsing. Things were bad when we learned that September’s miss of 135k vs. 145k expected hit the newswire, but they got worse when the report showed that August’s big jump of 195k was severely reduced to only 157k.
This does not bode well for Friday’s upcoming Labor Department non-farm payroll report, although sometimes these 2 data points can show some divergence.
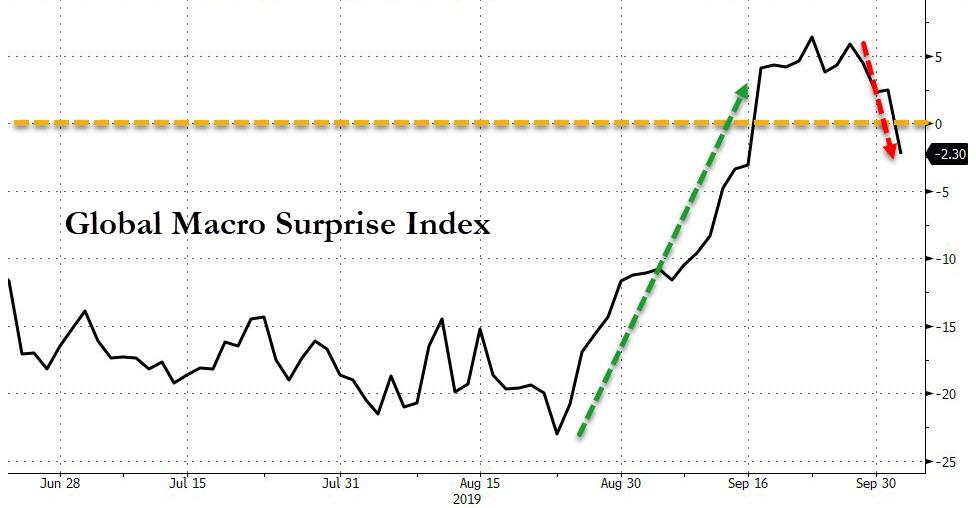
Looking at the big picture, “we see that trade tensions, global growth concerns, geopolitical risks and signs of profit margin compression are likely to limit upside going forward,” according to BofA. The Global Maco Surprise Index seems to substantiate these concerns by collapsing sharply.
The markets reacted accordingly, for a moment considering reality, as all major US equity indexes showed signs of breaking down, with the Dow, Nasdaq and S&P 500 all sinking below their 100 DMAs. Far worse was the performance of the SmallCaps (Russell 2000), which has now taken out it 200 DMA (Daily Moving Average).
Despite a rescue effort by the Fed’s Williams announcing that they have the tools (I guess to deal with the weak economic picture) and promised to use them earlier this time, market participants would have none of that empty talk and proceeded to, as I said yesterday, sell first and ask questions later.
On a personal note, I will not be posting tomorrow and Friday. This time it’s not a business issue, but a personal one. My wife and I will be traveling to San Diego to be part of my son’s wedding. I will, however, monitor the markets and adjust our holdings, should that become necessary. Regular posting will resume this coming Monday.
2. ETFs in the Spotlight
In case you missed the announcement and description of this section, you can read it here agai
It features 10 broadly diversified and sector ETFs from my HighVolume list as posted every Saturday. Furthermore, they are screened for the lowest MaxDD% number meaning they have been showing better resistance to temporary sell offs than all others over the past year.
The below table simply demonstrates the magnitude with which some of the ETFs are fluctuating regarding their positions above or below their respective individual trend lines (%+/-M/A). A break below, represented by a negative number, shows weakness, while a break above, represented by a positive percentage, shows strength.
For hundreds of ETF choices, be sure to reference Thursday’s StatSheet.
For this current domestic “Buy” cycle, here’s how some our candidates have fared:
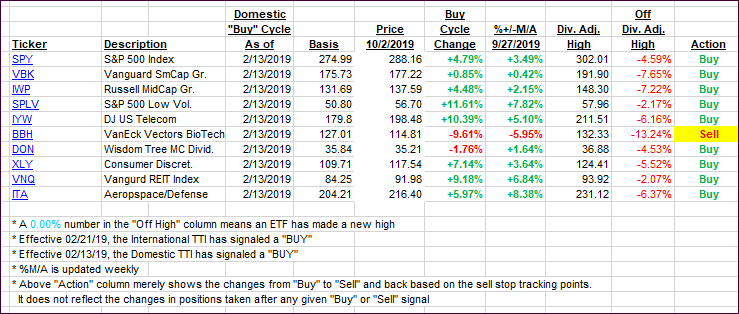
Again, the %+/-M/A column above shows the position of the various ETFs in relation to their respective long-term trend lines, while the trailing sell stops are being tracked in the “Off High” column. The “Action” column will signal a “Sell” once the -8% point has been taken out in the “Off High” column. For more volatile sector ETFs, the trigger point is -10%.
3. Trend Tracking Indexes (TTIs)
Our Trend Tracking Indexes (TTIs) headed sharply south with the International one now being solidly positioned below its long-term trend line. It’s only been its second day below it, so a quick rally out of nowhere could reverse that short-term trend in a hurry. I will observe the price action for another day or two, and if no improvements occur, this short ‘Buy’ cycle will be over.
Our Domestic TTI has also reached the danger zone where a potential ‘Sell’ may be in the cards. Here too, I like to see a clear piercing to the downside, accompanied by some staying power, before I will pull the plug.
Here’s how we closed 10/02/2019:
Domestic TTI: +0.43% above its M/A (prior close +2.37%)—Buy signal effective 02/13/2019
International TTI: -2.00% below its M/A (prior close -0.11%)—Buy signal effective 09/12/2019
Disclosure: I am obliged to inform you that I, as well as my advisory clients, own some of the ETFs listed in the above table. Furthermore, they do not represent a specific investment recommendation for you, they merely show which ETFs from the universe I track are falling within the specified guidelines.
Contact Ulli