
- Moving the markets
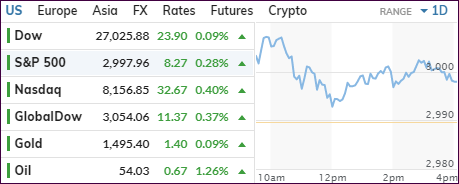
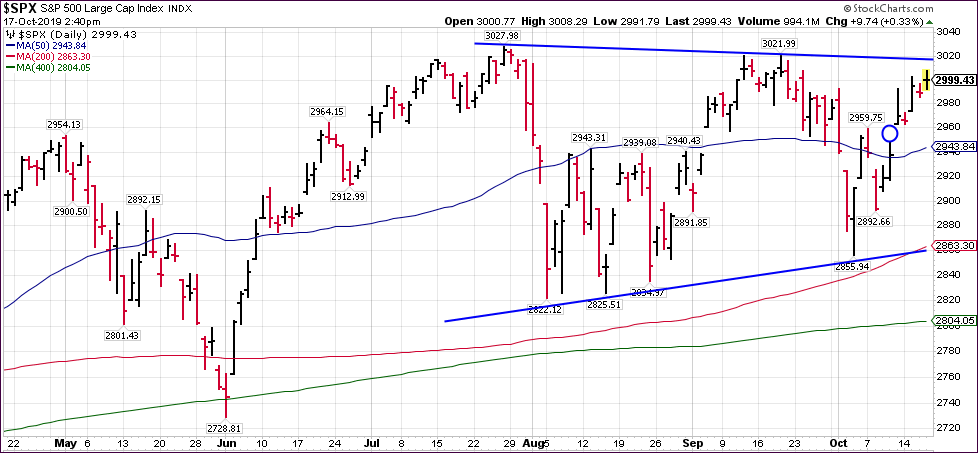
The major indexes edged higher early on, as the S&P500 fought hard to reclaim its 3,000-milestone marker. The index fluctuated all day slightly around that level but ended up slightly below it.
Helping the bullish enthusiasm were news of a potential Brexit deal, which turned out to be more of a rumor than a fact. Keep in mind that any new agreement still would need to be ratified by the British PM and the U.K. Parliament.
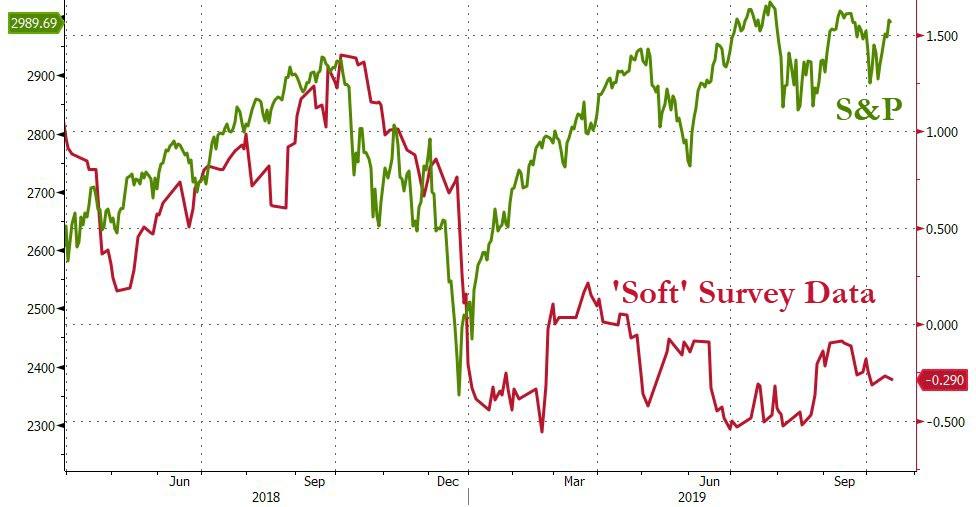
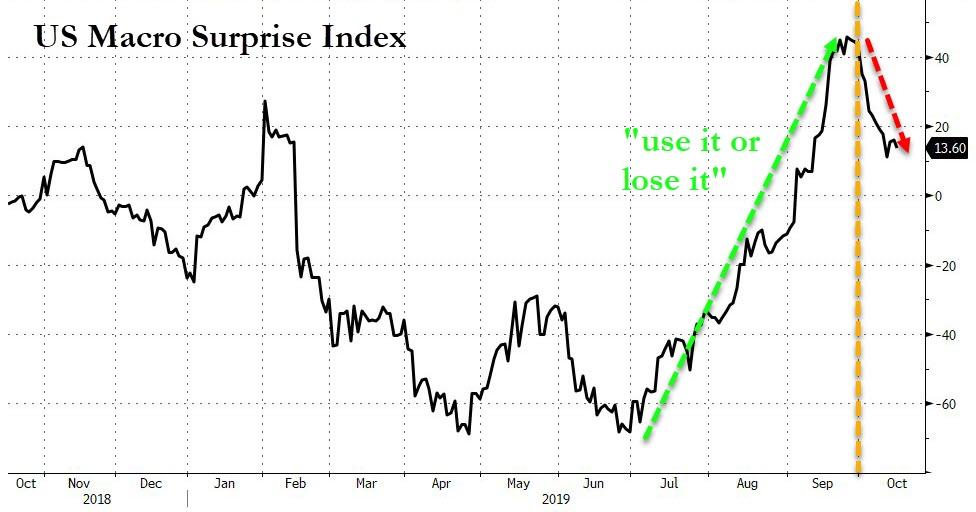
Economically speaking, the news provided a continued mixed picture, as Soft Survey data have completely decoupled from stock market levels, while the US Macro Surprise Index did an about face, causing ZH to quip “use it or lose it.”
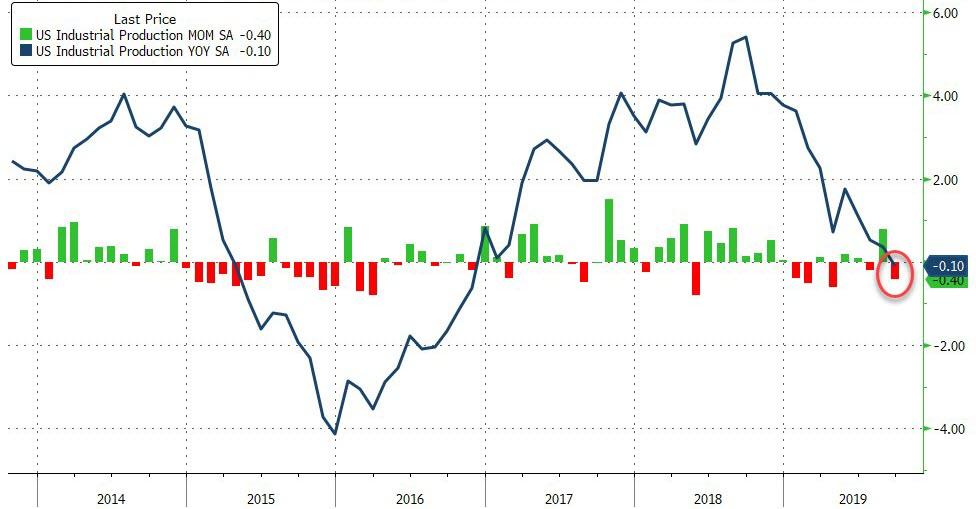
Industrial Production hit the skids and, on a YoY basis, shrunk for the first time since Trump’s election in November of 2016.
As I pointed out before, the US is not an island and, unless there is progress in global trade disputes, domestic econ data will hit the skids even more, which eventually will affect the direction of equities. Same trade disputes may impinge on earnings as well, just as last month, when bellwether FedEx cut its profit outlook in part due to trade and economic circumstances.
Given that, it’s almost a certainty that not only the Fed, but also other Central Banks (CBs) as well, will endorse more rate cuts in coming months to combat economic weakness. And that is exactly the fly in the ointment: Rates are already so low that CBs don’t have much room to act and put a bottom under equities. That means, eventually, bad economic news will be bad news for stocks.
From a technical point of view, a breakout above the September highs and then above the July all-time highs could, against all fundamental odds, bring a resumption of the bull market back into play. These days, anything is possible, meaning that we need to be prepared to deal with the unexpected.
2. ETFs in the Spotlight
In case you missed the announcement and description of this section, you can read it here again.
It features 10 broadly diversified and sector ETFs from my HighVolume list as posted every Saturday. Furthermore, they are screened for the lowest MaxDD% number meaning they have been showing better resistance to temporary sell offs than all others over the past year.
The below table simply demonstrates the magnitude with which some of the ETFs are fluctuating regarding their positions above or below their respective individual trend lines (%+/-M/A). A break below, represented by a negative number, shows weakness, while a break above, represented by a positive percentage, shows strength.
For hundreds of ETF choices, be sure to reference Thursday’s StatSheet.
For this current domestic “Buy” cycle, here’s how some our candidates have fared:
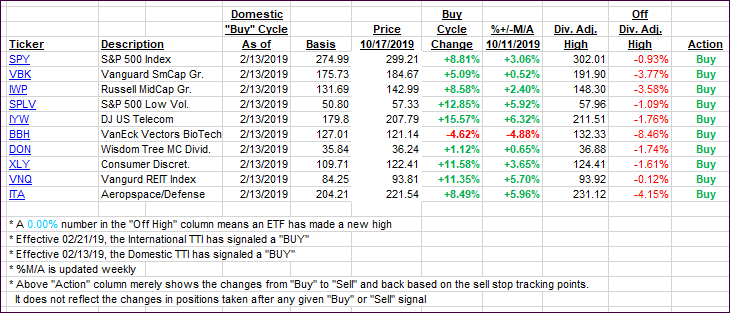
Again, the %+/-M/A column above shows the position of the various ETFs in relation to their respective long-term trend lines, while the trailing sell stops are being tracked in the “Off High” column. The “Action” column will signal a “Sell” once the -8% point has been taken out in the “Off High” column. For more volatile sector ETFs, the trigger point is -10%.
3. Trend Tracking Indexes (TTIs)
Our Trend Tracking Indexes (TTIs) increased modestly with the S&P 500 continuing its struggle with the 3,000 marker.
Here’s how we closed 10/17/2019:
Domestic TTI: +3.17% above its M/A (prior close +2.78%)—Buy signal effective 02/13/2019
International TTI: +1.50% above its M/A (prior close +1.24%)—Sell signal effective 10/03/2019
Disclosure: I am obliged to inform you that I, as well as my advisory clients, own some of the ETFs listed in the above table. Furthermore, they do not represent a specific investment recommendation for you, they merely show which ETFs from the universe I track are falling within the specified guidelines.
Contact Ulli