
- Moving the markets
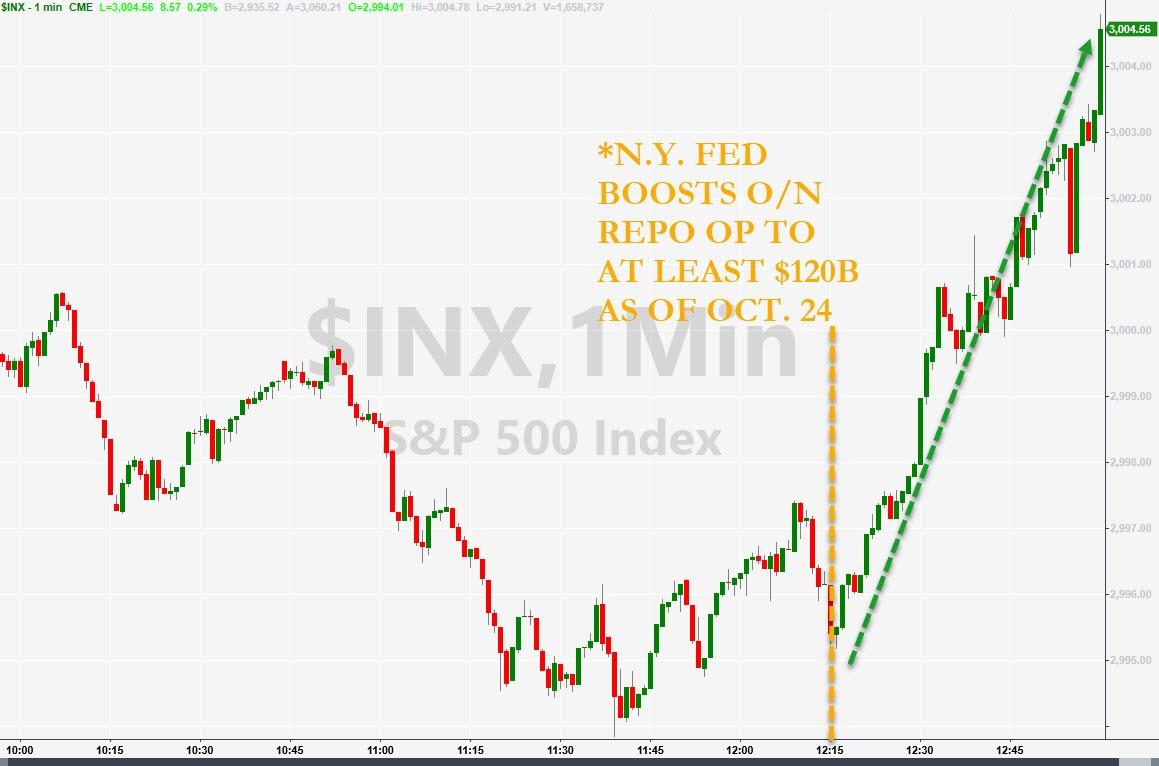
Yesterday’s last-minute pump, to get the major indexes to a green close, finally made sense, when it became known that the Fed had injected $134 billion in liquidity in the repo markets. This event sparked a furious last hour rally, which ZH charted like this.
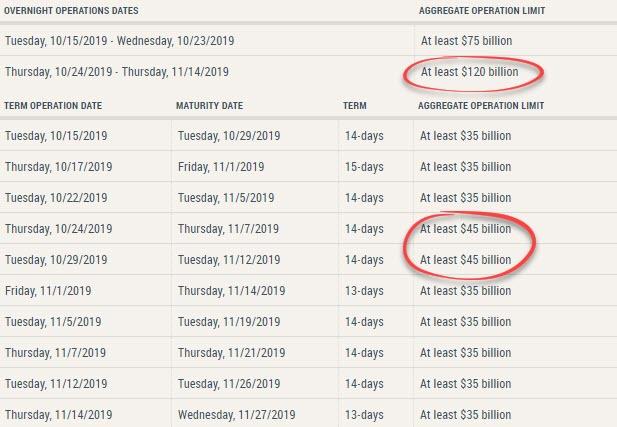
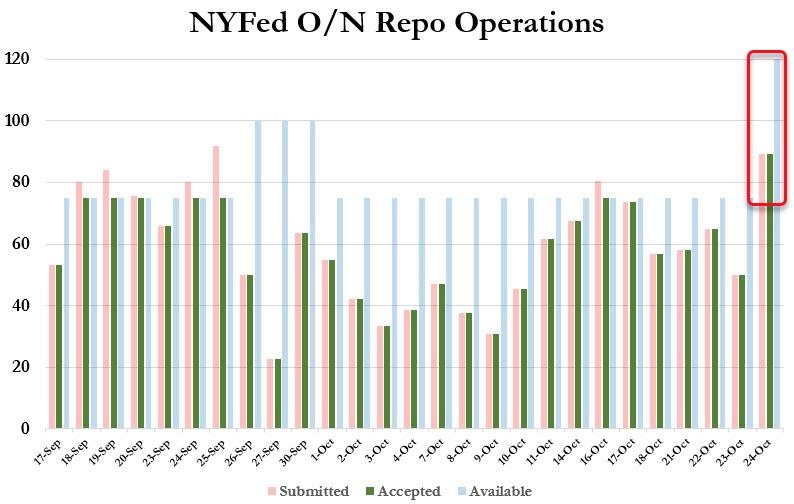
As the table shows, the increase in liquidity availability for overnight repos was increased from $75 billion to $120 billion, while term repos jumped from $35 billion to $45 billion. The overnight repo was the biggest ever, which again begs the questions “what is broken?” and “will it go exponential?”
Added ZH:
The only possible explanation, is someone really needed to lock in cash for month end (the maturity of the op is on Nov 7) which is when a “No Deal” Brexit may go live, and as a result one or more banks are bracing for the worst. The question, as before, remains why: just what is the source of this unprecedented spike in liquidity needs in a system which already has $1.5 trillion in excess reserves? And while we await the answer, expect stocks to close pleasantly in the green as dealers transform their newly granted liquidity into bets on risk assets.
These are serious issues with potentially significant repercussions for equity markets, which so far have simply shrugged off this event. In my view, this will not end well…
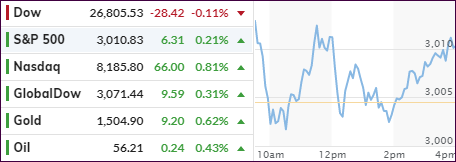
However, for the time being, the major indexes continued their aimless meandering around their respective unchanged lines with a bullish bias, as headline earnings reports provided a mixed picture.
MarketWatch featured these highlights:
Microsoft’s stock surges as big earnings beat prompts analysts to boost price targets
Twitter stock tumbles 20% after company says advertising bugs weighing on earnings
Comcast’s stock surges after profit, revenue rise above expectations
Nokia’s stock plummets toward worst day in 19 years on heavy volume after profit warning
On the economic side, things did not look encouraging with US New Home Sales slowing in September, as prices plunged to their lowest since 2017. Not to be outdone, the Durable Goods report showed that orders tumbled last month, while Business Investment contracted the most since Trump’s election.
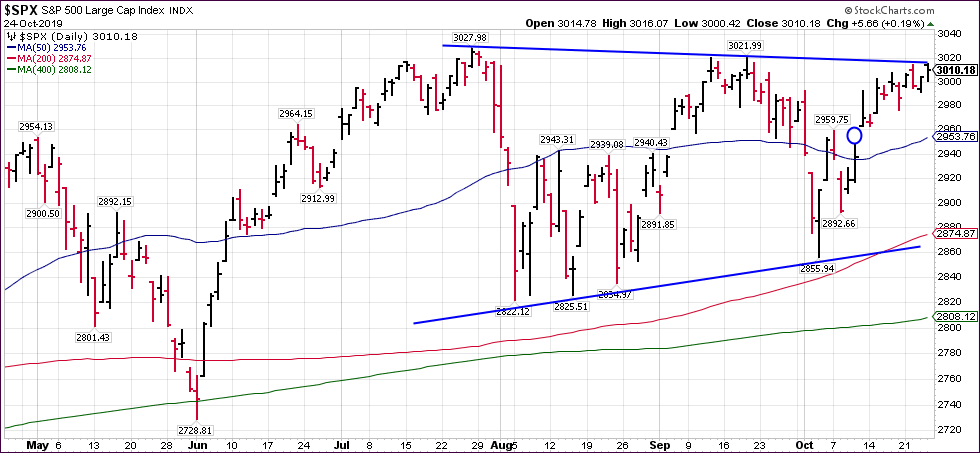
Still, it looks to me that traders and computer algos are eagerly awaiting Amazon’s earnings, due out after the close today. If expectations are solidly beat, this may provide enough optimism/firepower to propel the indexes into all-time high territory, which is not a big deal, since we have been hovering within striking distance (around 1%) for a while.
2. ETFs in the Spotlight
In case you missed the announcement and description of this section, you can read it here again.
It features 10 broadly diversified and sector ETFs from my HighVolume list as posted every Saturday. Furthermore, they are screened for the lowest MaxDD% number meaning they have been showing better resistance to temporary sell offs than all others over the past year.
The below table simply demonstrates the magnitude with which some of the ETFs are fluctuating regarding their positions above or below their respective individual trend lines (%+/-M/A). A break below, represented by a negative number, shows weakness, while a break above, represented by a positive percentage, shows strength.
For hundreds of ETF choices, be sure to reference Thursday’s StatSheet.
For this current domestic “Buy” cycle, here’s how some our candidates have fared:
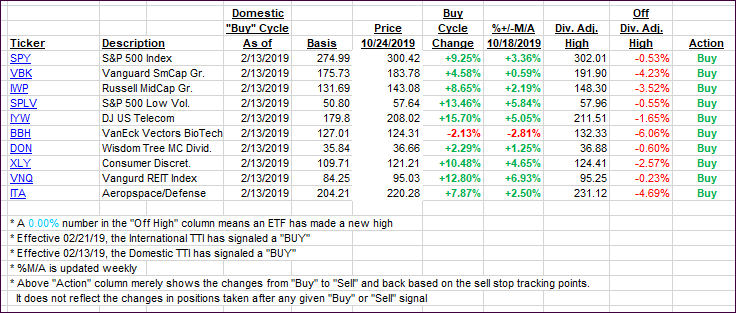
Again, the %+/-M/A column above shows the position of the various ETFs in relation to their respective long-term trend lines, while the trailing sell stops are being tracked in the “Off High” column. The “Action” column will signal a “Sell” once the -8% point has been taken out in the “Off High” column. For more volatile sector ETFs, the trigger point is -10%.
3. Trend Tracking Indexes (TTIs)
Our Trend Tracking Indexes (TTIs) barely changed as the sideways pattern, although with a slight bullish bias, continued.
Here’s how we closed 10/24/2019:
Domestic TTI: +3.94% above its M/A (prior close +3.88%)—Buy signal effective 02/13/2019
International TTI: +1.95% above its M/A (prior close +1.90%)—Sell signal effective 10/03/2019
Disclosure: I am obliged to inform you that I, as well as my advisory clients, own some of the ETFs listed in the above table. Furthermore, they do not represent a specific investment recommendation for you, they merely show which ETFs from the universe I track are falling within the specified guidelines.
Contact Ulli
Comments 2
Hey, Ulli
Week after week, all I see in your daily reports has been negativity and cynicism. This while the stock market continues to perform to the benefit of long term investors. You tell me that your readers communicate with you via personal email, not sharing their observations to the general subscriber. I conclude that they are satisfied with your constant warnings that catastrophe lies just ahead for the market, as daily predicted by ZH.
I challenge you to find and report on something positive about this market. I can find many positive things to contemplate associated with our healthy economy. Can you?
Smokey
10/24/19
Author
Smokey,
Obviously, we see things in a different light. I consider my view realistic and not negative. I prefer not to get swept up in the mindless day-to-day headlines hyping markets and economic conditions that are for the most part fake, phony and false. I come from a country that has seen the devastating effects of reckless money printing, and no, this time it will not be different.
Ulli…