
- Moving the markets
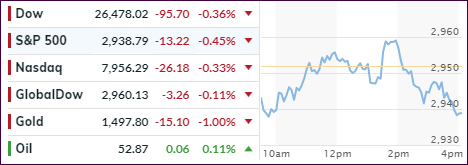
An early drop was followed by a pop above the unchanged line but in the end, equities simply ran out of steam with the S&P closing at its lows for the session.
Early words of hope regarding the always uncertain US-Trade relations managed to pull the markets higher, but even the often confused computer algos must have interpreted that as nothing but hot air, and down we went.
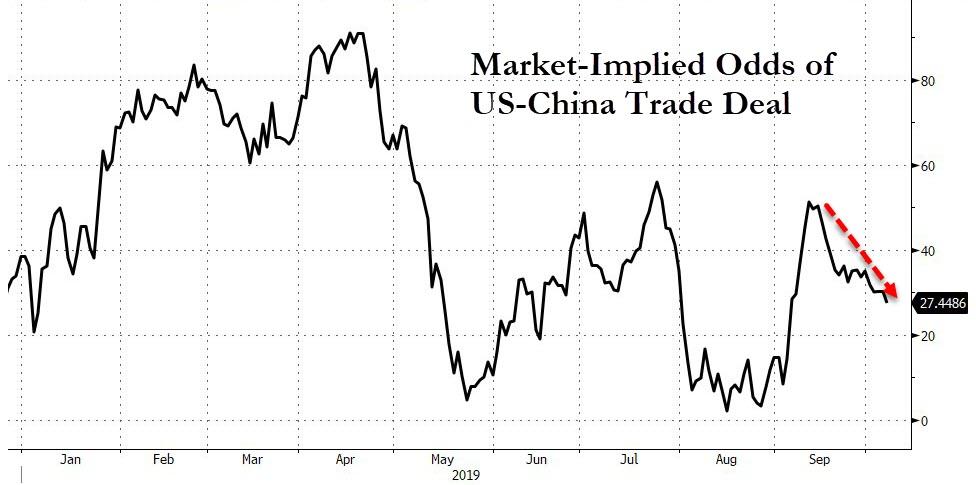
Of course, uncertainty reigned supreme with high-level tariff negotiations between Washington and Beijing being on deck for later this week. Setting the tone were Chinese officials, as they expressed reluctance to hammer out a broad agreement in Washington this Thursday and Friday. The market odds seem to support that view.
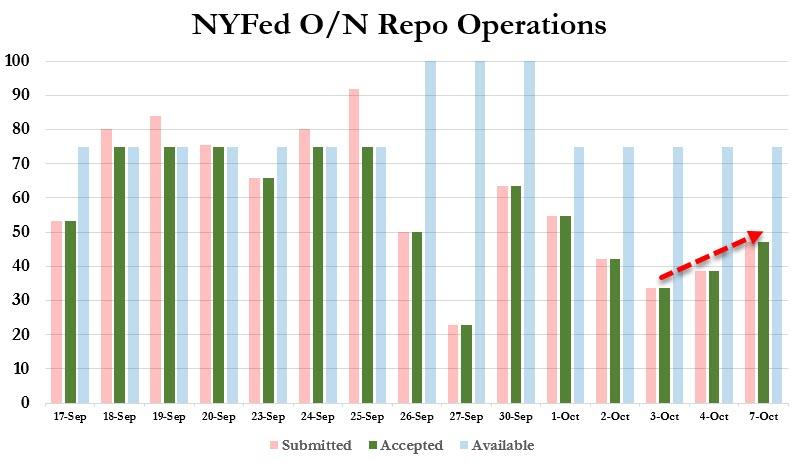
I have commented on the rather complex inner workings of the overnight repo market, as well the fact that some of the financial plumbing appears either not to be not working or has simply broken down. ZH presented this chart showing that, despite the last quarter being over, the problems continued, as repo demand has picked up again.
As I posted before, a short-term disconnect is nothing to worry about, but we’re now past the point of a temporary assist by the Fed, and I will watch closely if this will turn into a precursor for more weakness in equities.
2. ETFs in the Spotlight
In case you missed the announcement and description of this section, you can read it here again.
It features 10 broadly diversified and sector ETFs from my HighVolume list as posted every Saturday. Furthermore, they are screened for the lowest MaxDD% number meaning they have been showing better resistance to temporary sell offs than all others over the past year.
The below table simply demonstrates the magnitude with which some of the ETFs are fluctuating regarding their positions above or below their respective individual trend lines (%+/-M/A). A break below, represented by a negative number, shows weakness, while a break above, represented by a positive percentage, shows strength.
For hundreds of ETF choices, be sure to reference Thursday’s StatSheet.
For this current domestic “Buy” cycle, here’s how some our candidates have fared:
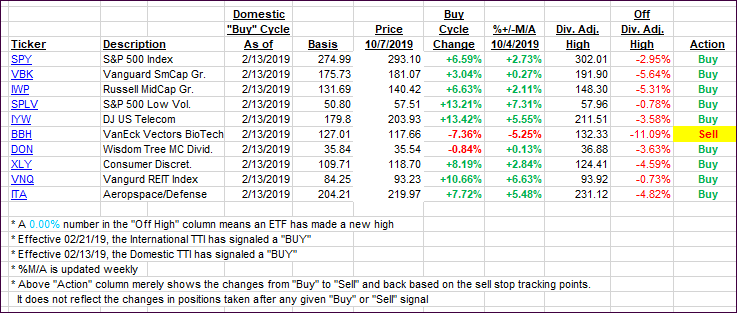
Again, the %+/-M/A column above shows the position of the various ETFs in relation to their respective long-term trend lines, while the trailing sell stops are being tracked in the “Off High” column. The “Action” column will signal a “Sell” once the -8% point has been taken out in the “Off High” column. For more volatile sector ETFs, the trigger point is -10%.
3. Trend Tracking Indexes (TTIs)
Our Trend Tracking Indexes (TTIs) both retreated as the major indexes whip-sawed all day with no clear direction apparent.
Here’s how we closed 10/07/2019:
Domestic TTI: +1.36% above its M/A (prior close +1.91%)—Buy signal effective 02/13/2019
International TTI: -1.48% below its M/A (prior close -1.34%)—Sell signal effective 10/03/2019
Disclosure: I am obliged to inform you that I, as well as my advisory clients, own some of the ETFs listed in the above table. Furthermore, they do not represent a specific investment recommendation for you, they merely show which ETFs from the universe I track are falling within the specified guidelines.
Contact Ulli