
- Moving the markets
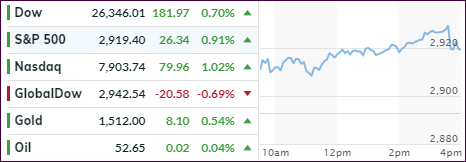
It seems like yesterday’s trade jawboning between the US and China had taken on too harsh of a tone, so both parties attempted to ease festering tensions. News reports indicated that China was open to a “limited or partial tariff solution” while offering to increase purchases of agricultural products from US farmers to $50 billion.
That was enough of a driver to push the indexes higher, despite weak domestic data showing Job Openings plunging to a 17-month low and confirming that Hiring/Quitting continues to remain on a slippery slope.
Then the Minutes from the last FOMC meeting on interest rates showed that officials have become somewhat concerned about the state of the economy with some members arguing that the chances of a U.S. recession “had increased notably in recent months.”
While that is a negative, it is not one in today’s environment, where stock market levels are largely supported by ever decreasing interest rates. And, a recessionary environment pretty much guarantees that rates will head lower, which is exactly what the markets anticipate when the Fed meets later this month.
While today’s rebound encouraged the bullish crowd, it’s noteworthy that this activity was accompanied by very low volume, about 30% below average, which means the rally was lacking conviction and may not have enough legs to continue.
Be that as it may, our Trend Tracking Index (TTI), after slipping below its long-term trend line yesterday, mustered enough strength to climb back above it by +0.49% indicating, at least for the time being, that the bullish trend is still alive.
2. ETFs in the Spotlight
In case you missed the announcement and description of this section, you can read it here again.
It features 10 broadly diversified and sector ETFs from my HighVolume list as posted every Saturday. Furthermore, they are screened for the lowest MaxDD% number meaning they have been showing better resistance to temporary sell offs than all others over the past year.
The below table simply demonstrates the magnitude with which some of the ETFs are fluctuating regarding their positions above or below their respective individual trend lines (%+/-M/A). A break below, represented by a negative number, shows weakness, while a break above, represented by a positive percentage, shows strength.
For hundreds of ETF choices, be sure to reference Thursday’s StatSheet.
For this current domestic “Buy” cycle, here’s how some our candidates have fared:
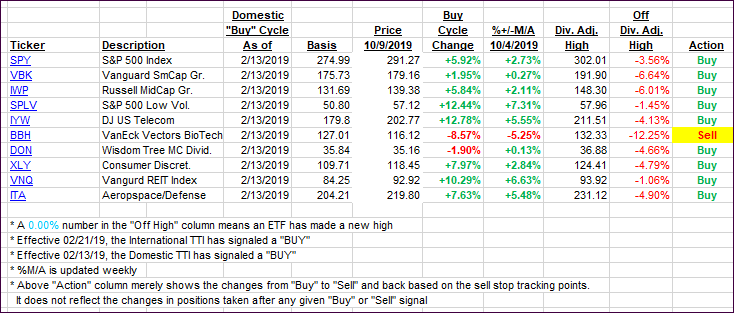
Again, the %+/-M/A column above shows the position of the various ETFs in relation to their respective long-term trend lines, while the trailing sell stops are being tracked in the “Off High” column. The “Action” column will signal a “Sell” once the -8% point has been taken out in the “Off High” column. For more volatile sector ETFs, the trigger point is -10%.
3. Trend Tracking Indexes (TTIs)
Our Trend Tracking Indexes (TTIs) recovered with the Domestic one reclaiming its trend line, although by only a small margin. For right now, the bullish theme is alive and well.
Here’s how we closed 10/09/2019:
Domestic TTI: +0.49% above its M/A (prior close -0.39%)—Buy signal effective 02/13/2019
International TTI: -2.07% below its M/A (prior close -2.53%)—Sell signal effective 10/03/2019
Disclosure: I am obliged to inform you that I, as well as my advisory clients, own some of the ETFs listed in the above table. Furthermore, they do not represent a specific investment recommendation for you, they merely show which ETFs from the universe I track are falling within the specified guidelines.
Contact Ulli