
- Moving the markets
Well, it sure didn’t take much effort to keep the markets going, as Trump successfully dangled the trade carrot again via this tweet:
“Big day of negotiations with China. They want to make a deal, but do I? I meet with the Vice Premier tomorrow at The White House.”
While this did not indicate really anything, the computer algos saw it as a positive, since China’s chief trade negotiator Vice Premier Liu He is staying in town till Friday, at least for now. That was all it took to ramp the markets higher in a vain attempt to get back to even for the week.
However, a US-China deal is based on nothing but hope, because as ZH noted correctly:
“The US has not changed its extensive and rigorous requests for China, nor has it responded to China’s core concerns,” Renmin University international relations professor Shi Yinhong said.
“Even if there is a deal, it could only be a mini-deal, even a minimal mini-deal. A currency pact, if true, does not bring any substance.”
But optimism is all that matters, so we’ll have to wait and see how this movie plays out. Given recent history, this could very well turn into another head fake.
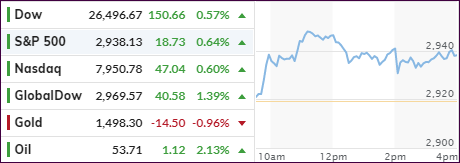
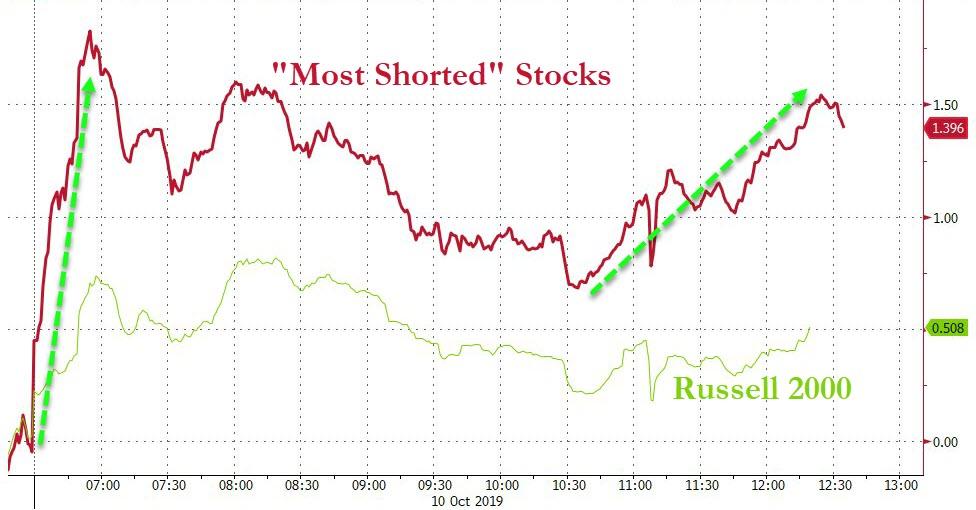
In the meantime, the major indexes managed to whipsaw around above their respective unchanged lines and scored another winning session for the second day in row, which was in part supported by a short squeeze in SmallCaps.
Still, the S&P 500 needs to gain about 1.3% from today’s level in order to reach last Friday’s close.
2. ETFs in the Spotlight
In case you missed the announcement and description of this section, you can read it here again.
It features 10 broadly diversified and sector ETFs from my HighVolume list as posted every Saturday. Furthermore, they are screened for the lowest MaxDD% number meaning they have been showing better resistance to temporary sell offs than all others over the past year.
The below table simply demonstrates the magnitude with which some of the ETFs are fluctuating regarding their positions above or below their respective individual trend lines (%+/-M/A). A break below, represented by a negative number, shows weakness, while a break above, represented by a positive percentage, shows strength.
For hundreds of ETF choices, be sure to reference Thursday’s StatSheet.
For this current domestic “Buy” cycle, here’s how some our candidates have fared:
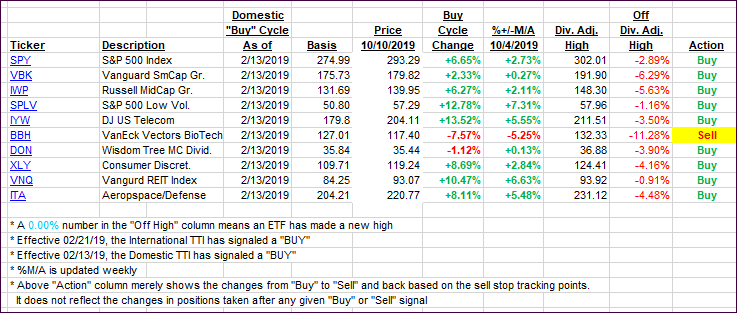
Again, the %+/-M/A column above shows the position of the various ETFs in relation to their respective long-term trend lines, while the trailing sell stops are being tracked in the “Off High” column. The “Action” column will signal a “Sell” once the -8% point has been taken out in the “Off High” column. For more volatile sector ETFs, the trigger point is -10%.
3. Trend Tracking Indexes (TTIs)
Our Trend Tracking Indexes (TTIs) improved as a rally based on new hope for a trade deal supported equities.
Here’s how we closed 10/10/2019:
Domestic TTI: +1.25% above its M/A (prior close +0.49%)—Buy signal effective 02/13/2019
International TTI: -1.16% below its M/A (prior close -2.07%)—Sell signal effective 10/03/2019
Disclosure: I am obliged to inform you that I, as well as my advisory clients, own some of the ETFs listed in the above table. Furthermore, they do not represent a specific investment recommendation for you, they merely show which ETFs from the universe I track are falling within the specified guidelines.
Contact Ulli