
- Moving the markets
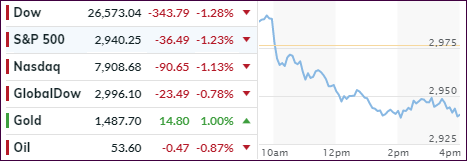
An early rally turned into a beating with the major indexes heading south all session long. The culprit was identified as downright ugly manufacturing information that had stocks and bond yields plunging.
The ISM manufacturing report came in at its worst level since 2009, as the index dropped to 47.8 in September from a prior 49.1. Expectations were for a 50.2 number. Any reading below 50 signals contraction, while any reading above signals expansion.
To many analysts, this was simply confirmation of an ongoing global slowdown and the conviction that US-China trade talks don’t look like they could contribute anything worthwhile in the near term.
Some of the brokerage houses imploded today, at least their stock prices did, when Charles Schwab came out and announced that they will do away with the $4.95 trade fee and offer zero commission for most stocks, ETFs and options as of October 7. While that will benefit all of us, brokerage businesses are extremely competitive and other firms will have to follow suit.
Disclosure: I have used Charles Schwab & Co as my custodian for clients’ assets since 1990, and I receive no compensation or any benefits from them.
Not covered by MSM is the continuing saga of the overnight lending issues between banks, as the Fed had to step in again this morning to financially “rescue” some of the participants. Not much is known as to what caused this problem, but it smells like a hidden bailout to me.
Analyst Sven Henrich had this to say:
We’re in the middle of an existential crisis. We must be. That’s what central bank policies are telling us.
After all the ECB cut rates to the lowest ever with its balance sheet being at record highs and expanding.
The central bank of Australia today cut rates to their lowest levels ever.
These are policies of absolute panic crisis levels are they not?
The Fed is intervening in repo markets every single day barely able to keep the effective Fed funds rate at target. They’ve already cut rates twice and are already expanding their balance sheet.
Without these interventions markets and the economy would fall apart. That’s the message that is being sent.
In any other time in history all these policy actions and their levels would be regarded as commensurate with a great crisis unfolding.
ZH summed the day up this way:
The moves today were quite shocking: Dow futures dropped 500 points from their overnight highs, 30Y Yields crashed 13bps from overnight highs, the dollar tumbled 0.6% intraday, and gold spiked $30. Additionally, rate-cut odds for October jumped higher to 60%…
I am sure that the month of October will have more surprises in store.
2. ETFs in the Spotlight
In case you missed the announcement and description of this section, you can read it here agai
It features 10 broadly diversified and sector ETFs from my HighVolume list as posted every Saturday. Furthermore, they are screened for the lowest MaxDD% number meaning they have been showing better resistance to temporary sell offs than all others over the past year.
The below table simply demonstrates the magnitude with which some of the ETFs are fluctuating regarding their positions above or below their respective individual trend lines (%+/-M/A). A break below, represented by a negative number, shows weakness, while a break above, represented by a positive percentage, shows strength.
For hundreds of ETF choices, be sure to reference Thursday’s StatSheet.
For this current domestic “Buy” cycle, here’s how some our candidates have fared:
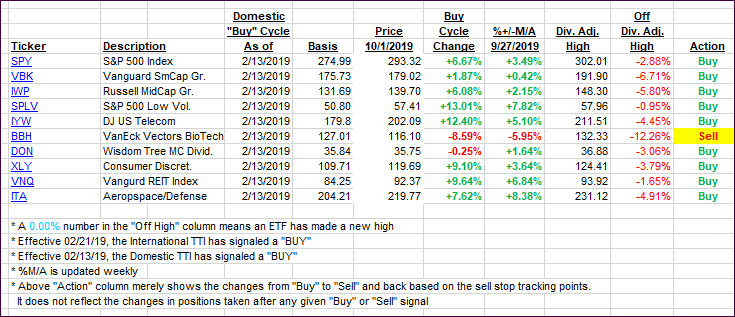
Again, the %+/-M/A column above shows the position of the various ETFs in relation to their respective long-term trend lines, while the trailing sell stops are being tracked in the “Off High” column. The “Action” column will signal a “Sell” once the -8% point has been taken out in the “Off High” column. For more volatile sector ETFs, the trigger point is -10%.
3. Trend Tracking Indexes (TTIs)
Our Trend Tracking Indexes (TTIs) took a dive and moved closer to their respective trend lines. The International one broke slightly below it, and I will monitor it closely to see if a new “Sell’ signal is in the making.
Here’s how we closed 10/01/2019:
Domestic TTI: +2.37% above its M/A (prior close +3.98%)—Buy signal effective 02/13/2019
International TTI: -0.11% below its M/A (prior close +0.73%)—Buy signal effective 09/12/2019
Disclosure: I am obliged to inform you that I, as well as my advisory clients, own some of the ETFs listed in the above table. Furthermore, they do not represent a specific investment recommendation for you, they merely show which ETFs from the universe I track are falling within the specified guidelines.
Contact Ulli