
- Moving the markets
After the Chinese offered not much hope for a successful outcome of the upcoming trade meeting, today it was the US’s turn to up the ante by blacklisting 28 Chinese companies due to alleged human-rights violations against Muslim minorities.
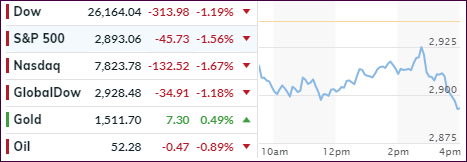
Should this mutual hostility fest continue, Friday’s scheduled high-level trade meeting might be over before it even starts. So, it came as no surprise that the markets sold off sharply, as “trade hope” has been one of the constant drivers of equities.
Then Fed head Powell attempted, with modest success, to levitate equities by announcing something that sounded like QE (Quantitative Easing) but wasn’t given that name. Here’s part of what he said:
While a range of factors may have contributed to these developments, it is clear that without a sufficient quantity of reserves in the banking system, even routine increases in funding pressures can lead to outsized movements in money market interest rates. This volatility can impede the effective implementation of monetary policy, and we are addressing it.
Indeed, my colleagues and I will soon announce measures to add to the supply of reserves over time.
Consistent with a decision we made in January, our goal is to provide an ample supply of reserves to ensure that control of the federal funds rate and other short-term interest rates is exercised primarily by setting our administered rates and not through frequent market interventions. Of course, we will not hesitate to conduct temporary operations if needed to foster trading in the federal funds market at rates within the target range.
“I want to emphasize that growth of our balance sheet for reserve management purposes should in no way be confused with the large-scale asset purchase programs that we deployed after the financial crisis.”
ZH supplied the rough translation of the above:
Don’t confuse balance sheet growth for “reserve management” with balance sheet growth for “stock market management.”
While that helped equities to regain some footing, it was short-lived, as Trump stepped up by announcing notable actions against human rights abusers in China, which just about destroyed any gains from Powell’s talk and furthermore may have put a big temporary nail in the trade coffin.
Stocks had enough of this and south we went in a hurry with the major indexes closing not only at new lows for the day but also hitting critical technical levels.
For the last 1.5 years, ZH has been tracking current market direction compared to events leading up to the crash of 1987, as this chart shows.
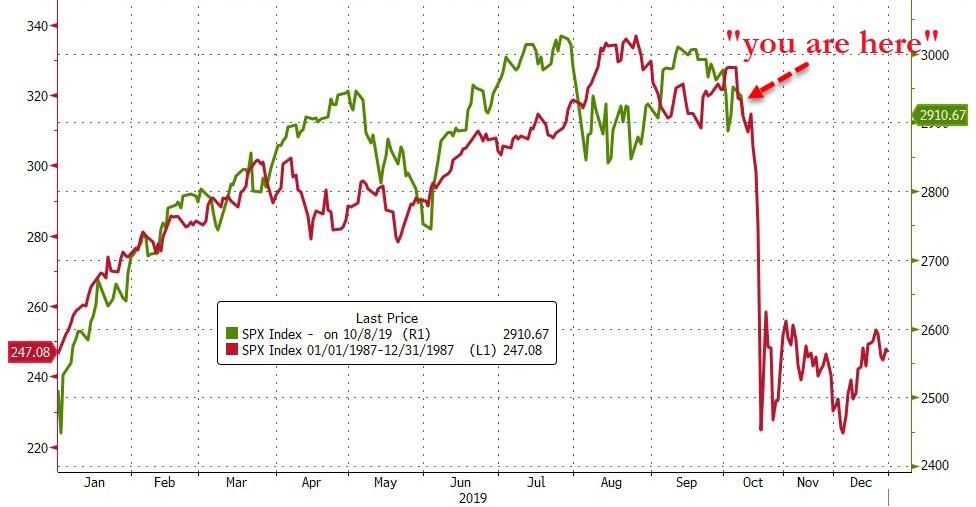
While history may not repeat, the above chart makes a solid case, that it may. Additionally, our main directional indicator, the Domestic Trend Tracking Index (TTI), pierced its long-term trend line to the downside today by -0.39% for the first time since February.
While this is only a scant piercing, it nevertheless indicates that tough times for stocks could be ahead. I will watch developments closely, and if more weakness persists tomorrow, will start liquidating some of our more volatile holdings with the remainder being on the chopping block soon thereafter.
I would not be the least bit surprised, given current and recent chaotic events, if we find ourselves back on the safety of the sidelines very soon and watching the markets self-destruct.
2. ETFs in the Spotlight
In case you missed the announcement and description of this section, you can read it here again.
It features 10 broadly diversified and sector ETFs from my HighVolume list as posted every Saturday. Furthermore, they are screened for the lowest MaxDD% number meaning they have been showing better resistance to temporary sell offs than all others over the past year.
The below table simply demonstrates the magnitude with which some of the ETFs are fluctuating regarding their positions above or below their respective individual trend lines (%+/-M/A). A break below, represented by a negative number, shows weakness, while a break above, represented by a positive percentage, shows strength.
For hundreds of ETF choices, be sure to reference Thursday’s StatSheet.
For this current domestic “Buy” cycle, here’s how some our candidates have fared:
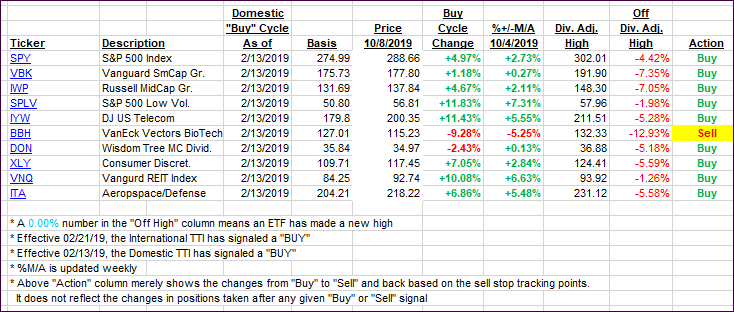
Again, the %+/-M/A column above shows the position of the various ETFs in relation to their respective long-term trend lines, while the trailing sell stops are being tracked in the “Off High” column. The “Action” column will signal a “Sell” once the -8% point has been taken out in the “Off High” column. For more volatile sector ETFs, the trigger point is -10%.
3. Trend Tracking Indexes (TTIs)
Our Trend Tracking Indexes (TTIs) dove as equities simply had another bad day. As commented above, the Domestic TTI crossed its trend line to the downside and, should more market weakness become apparent, I will first start liquidating our more volatile position before getting out of our low volatility holdings. The next few days will be critical!
Here’s how we closed 10/08/2019:
Domestic TTI: -0.39% below its M/A (prior close +1.36%)—Buy signal effective 02/13/2019
International TTI: -2.53% below its M/A (prior close -1.48%)—Sell signal effective 10/03/2019
Disclosure: I am obliged to inform you that I, as well as my advisory clients, own some of the ETFs listed in the above table. Furthermore, they do not represent a specific investment recommendation for you, they merely show which ETFs from the universe I track are falling within the specified guidelines.
Contact Ulli