
ETF Tracker StatSheet
You can view the latest version here.
SCRAMBLING AND TOUCHING NEW ALL-TIME HIGHS
- Moving the markets
The hope that Amazon’s earnings report would provide the firepower to propel the markets into record territory proved to be false, as the behemoth showed its first profit drop in two years, causing its stock to subsequently take a dive of some 8% in yesterday’s afterhours trading.
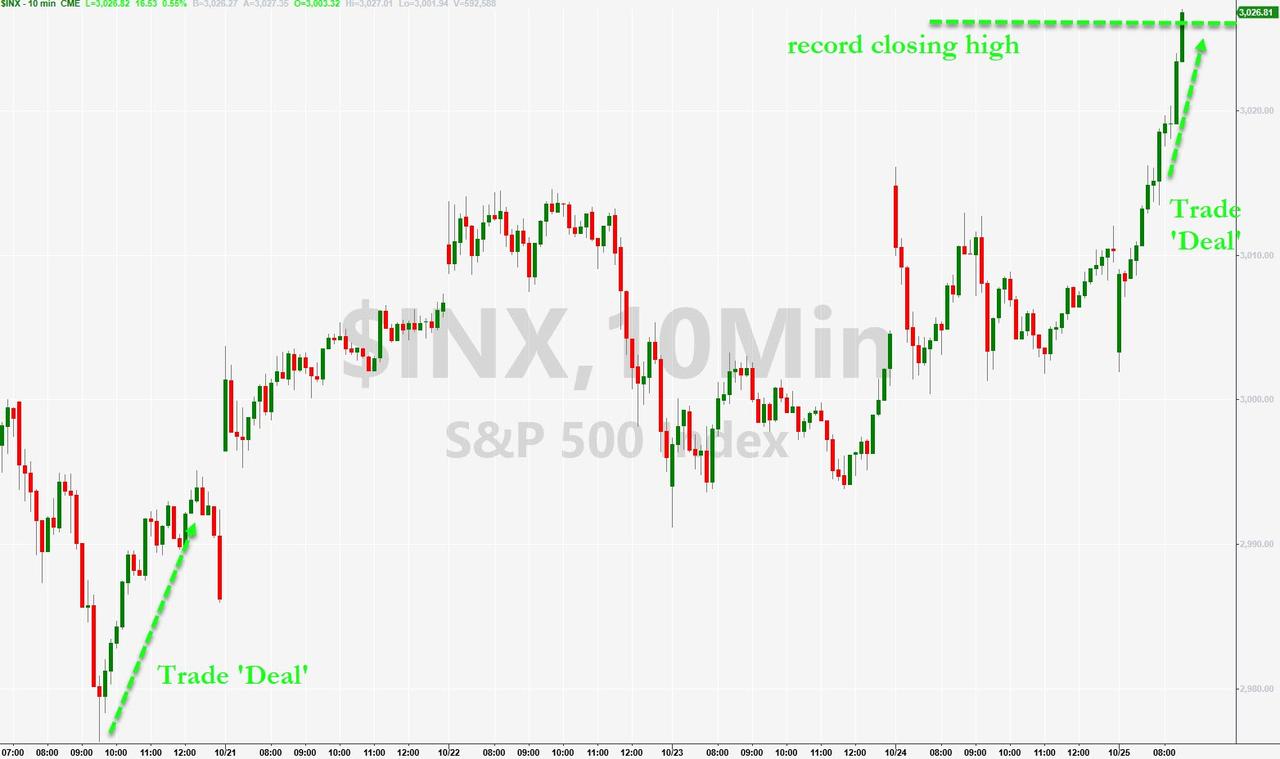
With that horse being out of commission, traders and algos needed a new driver to push the slow crawl of the indexes towards all-time highs into overdrive. That turned out to be the latest headlines promoting that “US and China are near completion of some aspects of the phase one trade deal that was supposed to be all papered last week.”
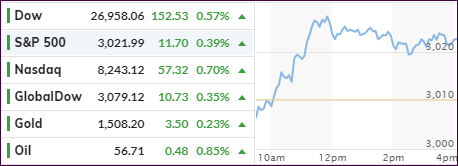
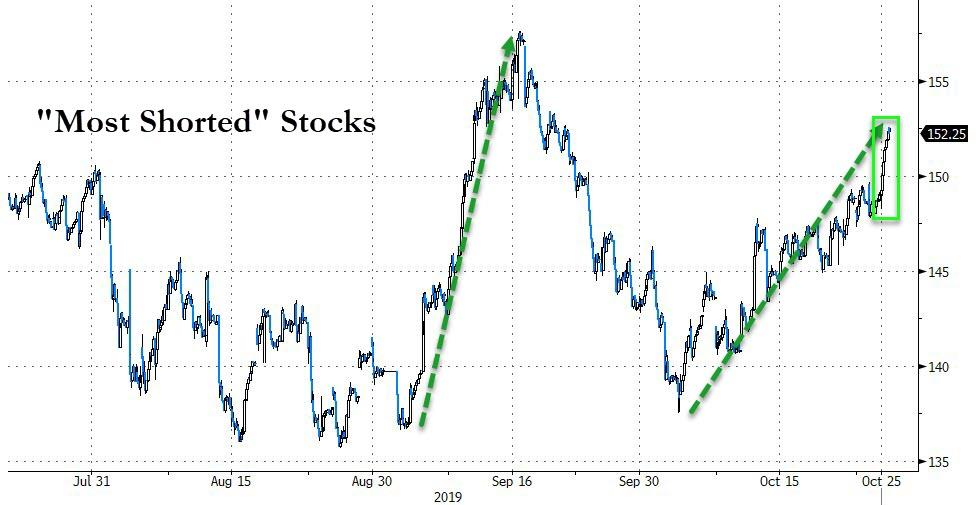
It worked, and the S&P 500 broke through overhead resistance in pursuit of the all-time intra-day level of 3,027.98, which it failed to conquer, but it managed to take out the previous closing high of 3,025.86 for a few minutes before pulling back. Giving an assist was the biggest short-squeeze in 6 weeks, which has been helping markets without many interruptions since the beginning of September.
For sure, any positive signs of either the existing US-China tariffs being suddenly dropped, or the actual signing of the phase 1 trade deal, will send global stocks higher.
Today’s move only required the S&P to gain less than 0.5% to touch new all-time highs. This happened in the face of rising bond yields, which gave the S&P 500 (SPY) the edge (+0.41%) over its low volatility cousin SPLV, which slid for the second day (-0.57%). Still, for this current ‘Buy’ cycle, SPLV remains the dominant force by having gained +12.76% vs. SPY’s 9.67%.
As far as market participants is concerned, next week’s Fed meeting on interest rates is a shoo-in and already a foregone conclusion. I only expect a strong market reaction, if they don’t cut (negative), or if they cut more than expected (positive).
Never mind that the US budget deficit for fiscal 2019 came in at almost $1 trillion ($984.4 billion to be exact), which was a whopping increase of 26.4% over the prior year, nor that US Economic Policy Uncertainty has soared to all-time record highs. Stocks are in their own world and appear to be climbing a wall of worry.
2. ETFs in the Spotlight
In case you missed the announcement and description of this section, you can read it here again.
It features 10 broadly diversified and sector ETFs from my HighVolume list as posted every Saturday. Furthermore, they are screened for the lowest MaxDD% number meaning they have been showing better resistance to temporary sell offs than all others over the past year.
The below table simply demonstrates the magnitude with which some of the ETFs are fluctuating regarding their positions above or below their respective individual trend lines (%+/-M/A). A break below, represented by a negative number, shows weakness, while a break above, represented by a positive percentage, shows strength.
For hundreds of ETF choices, be sure to reference Thursday’s StatSheet.
For this current domestic “Buy” cycle, here’s how some our candidates have fared:
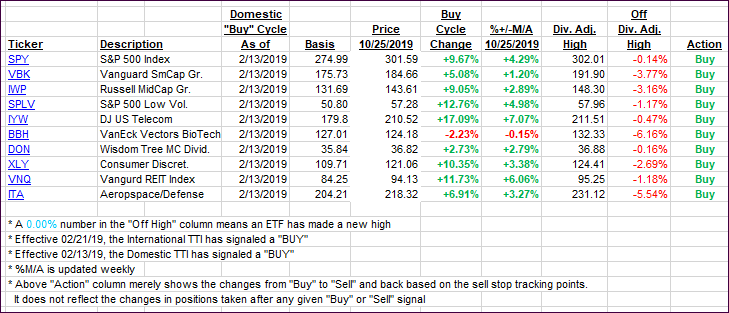
Again, the %+/-M/A column above shows the position of the various ETFs in relation to their respective long-term trend lines, while the trailing sell stops are being tracked in the “Off High” column. The “Action” column will signal a “Sell” once the -8% point has been taken out in the “Off High” column. For more volatile sector ETFs, the trigger point is -10%.
3. Trend Tracking Indexes (TTIs)
Our Trend Tracking Indexes (TTIs) inched up a tad as today’s reach towards all-time highs required only a fairly small advance.
Here’s how we closed 10/25/2019:
Domestic TTI: +3.99% above its M/A (prior close +3.94%)—Buy signal effective 02/13/2019
International TTI: +2.07% above its M/A (prior close +1.95%)—Sell signal effective 10/03/2019
Disclosure: I am obliged to inform you that I, as well as my advisory clients, own some of the ETFs listed in the above table. Furthermore, they do not represent a specific investment recommendation for you, they merely show which ETFs from the universe I track are falling within the specified guidelines.
———————————————————-
WOULD YOU LIKE TO HAVE YOUR INVESTMENTS PROFESSIONALLY MANAGED?
Do you have the time to follow our investment plans yourself? If you are a busy professional who would like to have his portfolio managed using our methodology, please contact me directly or get more details here.
———————————————————
Back issues of the ETF Tracker are available on the web.
Contact Ulli