
- Moving the markets
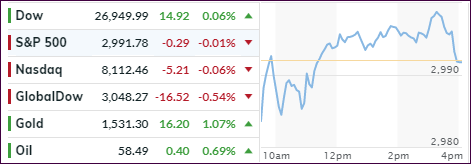
Early aimless meandering turned into a modest rally mid-day, but positive momentum faded in the end with the major indexes diving into the close with nothing to show for.
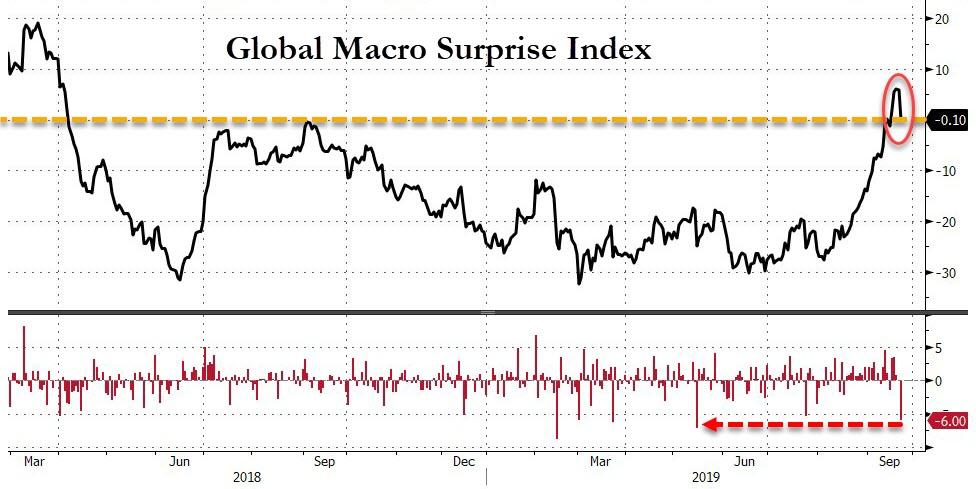
It came as no surprise that defensive sectors, such as consumer staples, led for most of the day, as the ‘weaker growth’ meme was present. This became abundantly clear as manufacturing data in the Eurozone contracted sharply in September and notching its worst reading in almost 7 years.
The data was simply awful for Germany, which is seen by many as Europe’s economic engine, but a report indicated that business conditions continue to deteriorate with the no end in sight. This obviously was known to the ECB when the lowered interest rates again last week. Things indeed look bleak for the Eurozone when their historically best performer and exporter is mired in what appears to be a recession.
And it’s not just Europe that is showing poor numbers, we also learned that powerhouse South Korea saw its exports collapse the most since 2009. Overall, it was the worst global data disappointment day since May and pushed the index back into contraction.
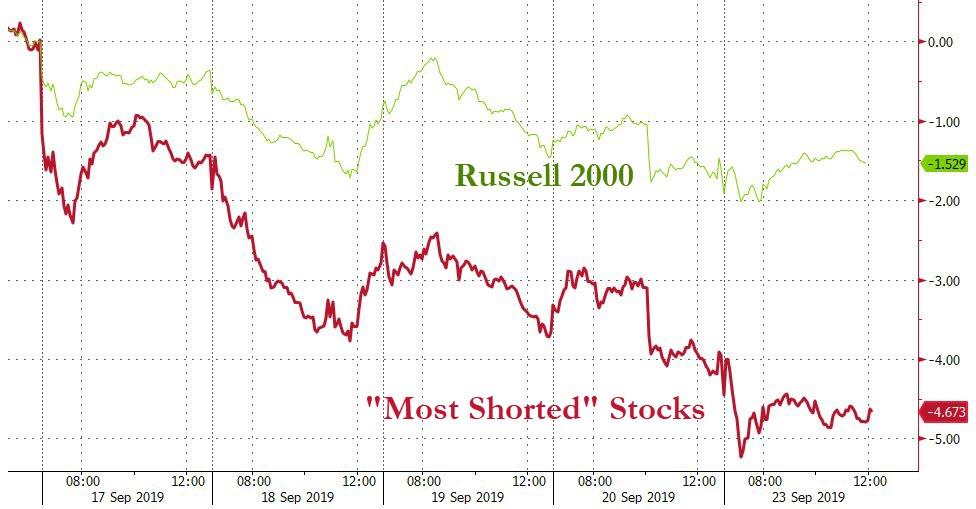
There was no short squeeze today, as the most shorted stocks did what they’re supposed to—namely head south, which they did for the 5th day in a row.
Since the indexes are within striking distance of hitting new all-time highs, we need a better driver to accomplish this than constantly worsening global economic data.
2. ETFs in the Spotlight
In case you missed the announcement and description of this section, you can read it here again.
It features 10 broadly diversified and sector ETFs from my HighVolume list as posted every Saturday. Furthermore, they are screened for the lowest MaxDD% number meaning they have been showing better resistance to temporary sell offs than all others over the past year.
The below table simply demonstrates the magnitude with which some of the ETFs are fluctuating regarding their positions above or below their respective individual trend lines (%+/-M/A). A break below, represented by a negative number, shows weakness, while a break above, represented by a positive percentage, shows strength.
For hundreds of ETF choices, be sure to reference Thursday’s StatSheet.
For this current domestic “Buy” cycle, here’s how some our candidates have fared:
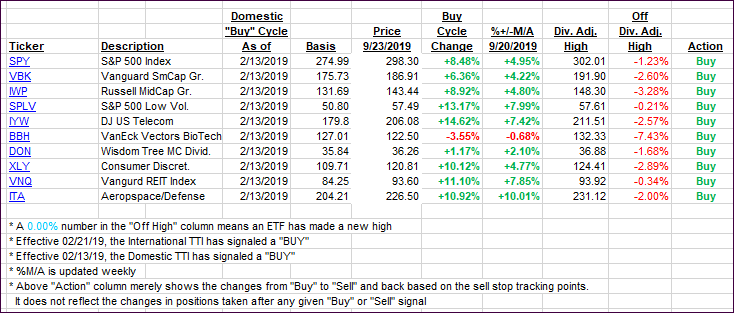
Again, the %+/-M/A column above shows the position of the various ETFs in relation to their respective long-term trend lines, while the trailing sell stops are being tracked in the “Off High” column. The “Action” column will signal a “Sell” once the -8% point has been taken out in the “Off High” column. For more volatile sector ETFs, the trigger point is -10%.
3. Trend Tracking Indexes (TTIs)
Our Trend Tracking Indexes (TTIs) pulled back with the International one taking a bigger hit due to weak global economic data releases.
Here’s how we closed 09/23/2019:
Domestic TTI: +4.33% above its M/A (prior close +4.71%)—Buy signal effective 02/13/2019
International TTI: +1.88% above its M/A (prior close +2.47%)—Buy signal effective 09/12/2019
Disclosure: I am obliged to inform you that I, as well as my advisory clients, own some of the ETFs listed in the above table. Furthermore, they do not represent a specific investment recommendation for you, they merely show which ETFs from the universe I track are falling within the specified guidelines.
Contact Ulli