
- Moving the markets
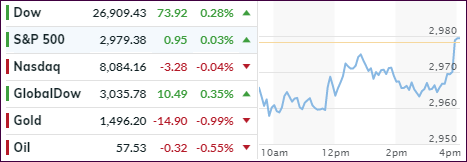
Throughout the session, the major indexes hovered below their respective unchanged lines, as US-China trade news offered a mixed picture, while a look ahead to the upcoming central bank policy meetings kept traders on edge.
Except for a last-minute spike in equities, interest rates kept a lid on advances with the 10-year bond yield rising over 8 basis points to end the day at 1.73%, which is quite a rebound considering that just recently we breached the 1.5% level to the downside.
These are huge moves, as the bond bloodbath continues, so it comes as no surprise that the victims over the past few days have been bond prices, as well as the low volatility ETFs (SPLV and USMV), which have been surrendering some of their superior gains. For context, 10-year yields are up 5 days in a row, gaining an amazing 24 basis points, which is the biggest jump since Trump’s election in 2016.
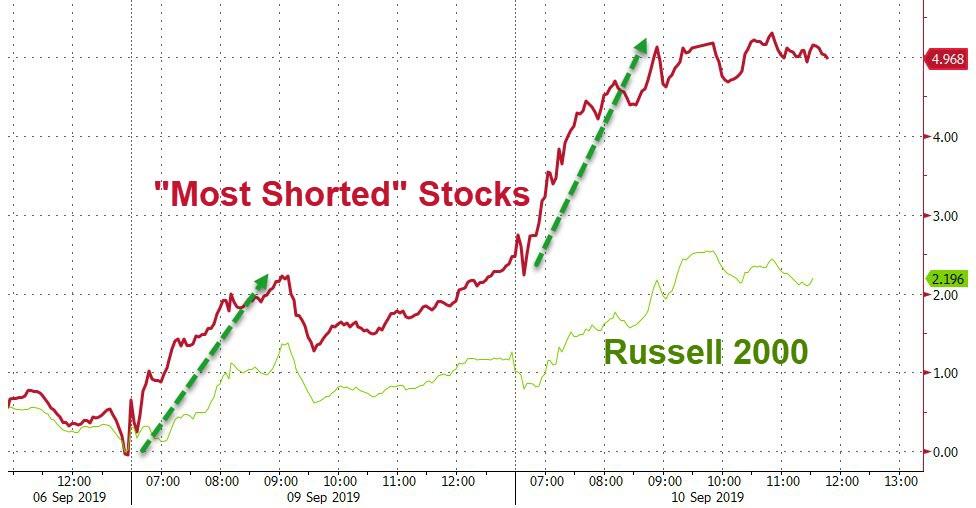
There seems to be a global re-shuffling of assets going on, as the unwind has pushed cyclicals higher and defensives lower with Transportations and SmallCaps suddenly surging, while the Nasdaq tumbled most of the day, but it was pushed to almost even at the close.
ZH reports that the most shorted stocks went on a rampage by soaring this week and actually registering the biggest 5-day short squeeze since the beginning of this year.
It was a rollercoaster kind of day, and I would not be surprised to see the Volatility Index (VIX) make a move again, as Fed policy uncertainty has hit record highs.
2. ETFs in the Spotlight
In case you missed the announcement and description of this section, you can read it here again.
It features 10 broadly diversified and sector ETFs from my HighVolume list as posted every Saturday. Furthermore, they are screened for the lowest MaxDD% number meaning they have been showing better resistance to temporary sell offs than all others over the past year.
The below table simply demonstrates the magnitude with which some of the ETFs are fluctuating regarding their positions above or below their respective individual trend lines (%+/-M/A). A break below, represented by a negative number, shows weakness, while a break above, represented by a positive percentage, shows strength.
For hundreds of ETF choices, be sure to reference Thursday’s StatSheet.
For this current domestic “Buy” cycle, here’s how some our candidates have fared:
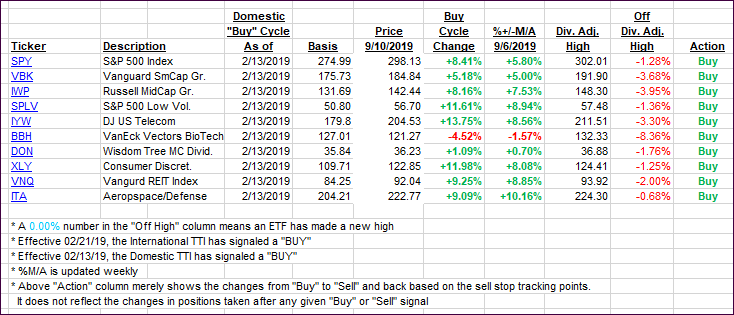
Again, the %+/-M/A column above shows the position of the various ETFs in relation to their respective long-term trend lines, while the trailing sell stops are being tracked in the “Off High” column. The “Action” column will signal a “Sell” once the -8% point has been taken out in the “Off High” column. For more volatile sector ETFs, the trigger point is -10%.
3. Trend Tracking Indexes (TTIs)
Our Trend Tracking Indexes (TTIs) changed only slightly. The International one is remaining above its trendline, but since this is only its 5th day above, I want to see a little more staying power before considering the current ‘Sell’ signal to be over. Sudden fast moves one direction of the other tend to be suspect in that a reversal can materialize just as quickly leading to a whip-saw.
Here’s how we closed 09/10/2019:
Domestic TTI: +5.50% above its M/A (prior close +5.02%)—Buy signal effective 02/13/2019
International TTI: +2.04% above its M/A (prior close +1.69%)—Sell signal effective 08/15/2019
Disclosure: I am obliged to inform you that I, as well as my advisory clients, own some of the ETFs listed in the above table. Furthermore, they do not represent a specific investment recommendation for you, they merely show which ETFs from the universe I track are falling within the specified guidelines.
Contact Ulli