
- Moving the markets
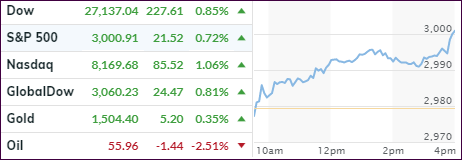
After a slow start, upward momentum picked up, and after a brief dip late in the session, the major indexes surged into the close led by the Nasdaq. The S&P 500 managed to barely reclaim its 3k marker, which it had surrendered at the beginning of August, while the Dow notched its 6th straight gain in a row.
The rotation from defensive and momentum driven stocks into cyclical and value-oriented ones continued. As I posted yesterday, during the recent spike in bond yields, traders had sold low volatility funds/ETFs to cash in on some outsized returns.
As a result, they lost a little bit of their luster, but in the case of SPLV, it still leads its more aggressive cousin SPY. It remains to be seen if the recent rally in SmallCaps can maintain current momentum, as its index, the Russell 2000, which has lagged the broader market for most of this year, is hovering more than 10% below its all-time high.
Meanwhile, bond yields headed higher again but a moderate pace with the 10-year adding 1.2 basis points to close at 1.746%.
Still, something seems out of whack in that equities should have reacted negatively to the sharp spike in bond yields over the past week. Rising yields indicate a strong economy, which on one hand is praised by the administration, while at the same time Trump is exerting tremendous pressure on the Fed (boneheads) to cut rates “to ZERO or less.” This makes me continue to ponder the question “why do we need rates at zero if the economy is so great?”
The assist for today’s push higher came again from the continued short-squeeze—up an incredible 12.75% in the last 6 days, according to ZH. This is the biggest short squeeze we’ve seen since August 2011, which explains why SmallCaps may have found a new life—at least for the moment, but how long can that last?
2. ETFs in the Spotlight
In case you missed the announcement and description of this section, you can read it here again.
It features 10 broadly diversified and sector ETFs from my HighVolume list as posted every Saturday. Furthermore, they are screened for the lowest MaxDD% number meaning they have been showing better resistance to temporary sell offs than all others over the past year.
The below table simply demonstrates the magnitude with which some of the ETFs are fluctuating regarding their positions above or below their respective individual trend lines (%+/-M/A). A break below, represented by a negative number, shows weakness, while a break above, represented by a positive percentage, shows strength.
For hundreds of ETF choices, be sure to reference Thursday’s StatSheet.
For this current domestic “Buy” cycle, here’s how some our candidates have fared:
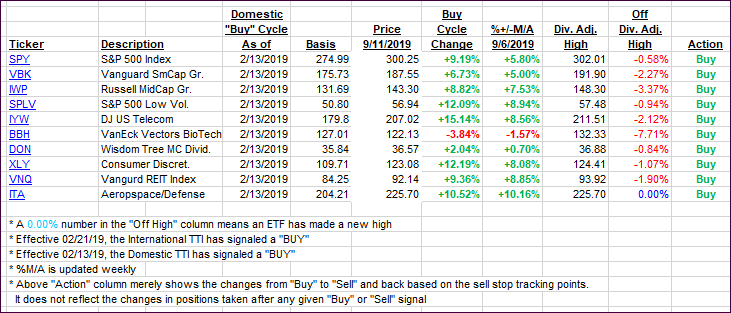
Again, the %+/-M/A column above shows the position of the various ETFs in relation to their respective long-term trend lines, while the trailing sell stops are being tracked in the “Off High” column. The “Action” column will signal a “Sell” once the -8% point has been taken out in the “Off High” column. For more volatile sector ETFs, the trigger point is -10%.
3. Trend Tracking Indexes (TTIs)
Our Trend Tracking Indexes (TTIs) jumped with the markets. The International one has now shown enough upward momentum and staying power that we now have a new ‘Buy’ in place. It affects all “broadly diversified international ETFs/mutual funds.” The effective date will be tomorrow, September 12, 2019.
For the sake of disclosure, I am informing you that in my advisor practice we will not participate in this signal due to us currently already being 100% invested.
Here’s how we closed 09/11/2019:
Domestic TTI: +6.31% above its M/A (prior close +5.50%)—Buy signal effective 02/13/2019
International TTI: +2.87% above its M/A (prior close +2.04%)—Buy signal effective 09/12/2019
Disclosure: I am obliged to inform you that I, as well as my advisory clients, own some of the ETFs listed in the above table. Furthermore, they do not represent a specific investment recommendation for you, they merely show which ETFs from the universe I track are falling within the specified guidelines.
Contact Ulli