
- Moving the markets
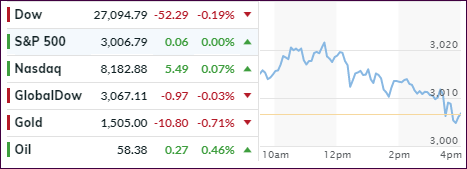
Yesterday’s “feel good” closing ramp carried over into today’s opening, as the major indexes were getting close to test new record highs. Better-than-expected housing and manufacturing data contribute to the bullish sentiment.
While the S&P 500 is within 1% of its record closing high, it may not get there until next week due to tomorrow’s quadruple witching day for the US markets. That means volatility may spike as a result of the simultaneous quarterly expiration of futures, options on indexes and stocks.
Yesterday, I mentioned the liquidity crunch in the overnight lending market. It continued today with the Fed promising billions of dollars to “support” the system from blowing out of control. The liquidity shortfall rose by almost $4 billion compared to Wednesday morning. Ouch!
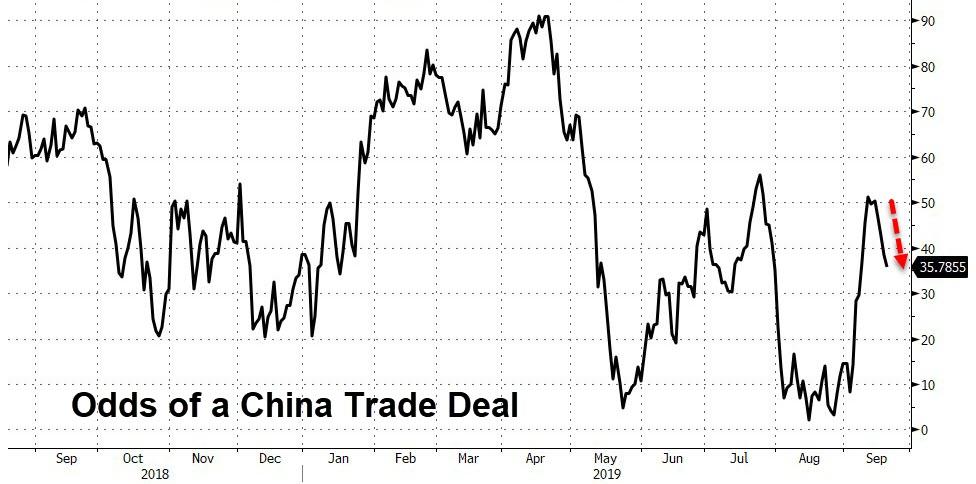
We saw some fallout of that, as the markets skidded, assisted by odds of a China trade deal slipping, with news hitting the headlines that the White House favors increasing some tariffs to possibly 50% or even 100%. That took the starch out of upward momentum, and we ended up just about unchanged.
Traders are still digesting the Fed’s rate cut, and we may not see any attempt to break through to all-time highs until next week, although that July 2019 high may very well serve as overhead resistance.
2. ETFs in the Spotlight
In case you missed the announcement and description of this section, you can read it here again.
It features 10 broadly diversified and sector ETFs from my HighVolume list as posted every Saturday. Furthermore, they are screened for the lowest MaxDD% number meaning they have been showing better resistance to temporary sell offs than all others over the past year.
The below table simply demonstrates the magnitude with which some of the ETFs are fluctuating regarding their positions above or below their respective individual trend lines (%+/-M/A). A break below, represented by a negative number, shows weakness, while a break above, represented by a positive percentage, shows strength.
For hundreds of ETF choices, be sure to reference Thursday’s StatSheet.
For this current domestic “Buy” cycle, here’s how some our candidates have fared:
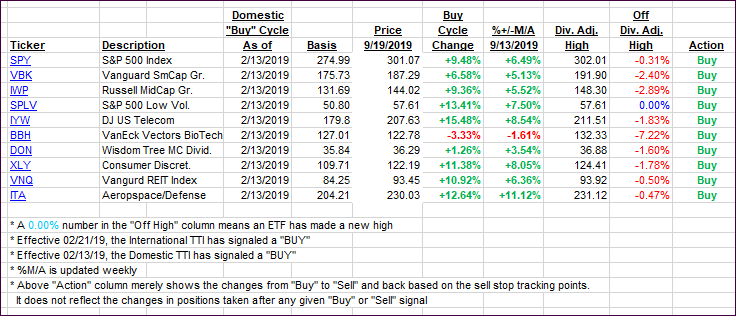
Again, the %+/-M/A column above shows the position of the various ETFs in relation to their respective long-term trend lines, while the trailing sell stops are being tracked in the “Off High” column. The “Action” column will signal a “Sell” once the -8% point has been taken out in the “Off High” column. For more volatile sector ETFs, the trigger point is -10%.
3. Trend Tracking Indexes (TTIs)
Our Trend Tracking Indexes (TTIs) were mixed with the Domestic one sliding, while the International one gained.
Here’s how we closed 09/19/2019:
Domestic TTI: +5.74% above its M/A (prior close +6.03%)—Buy signal effective 02/13/2019
International TTI: +2.86% above its M/A (prior close +2.67%)—Buy signal effective 09/12/2019
Disclosure: I am obliged to inform you that I, as well as my advisory clients, own some of the ETFs listed in the above table. Furthermore, they do not represent a specific investment recommendation for you, they merely show which ETFs from the universe I track are falling within the specified guidelines.
Contact Ulli