
- Moving the markets
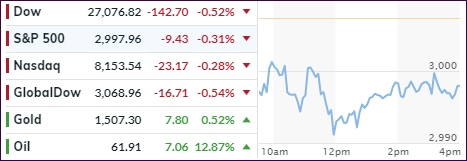
It came as no surprise that market sentiment took one on the chin, after Saturday’s drone attack on Saudi oil processing plants, which took about 5% of worldwide production offline.
While the major indexes retreated, it was a modest haircut considering the recent advances. Oil prices spiked about 13%, down from an earlier 20%, but if they keep rising and a dose of inflation sets in, we will see more of a negative effect on stocks, or specifically the broad S&P 500 index.
On one hand a hefty surge in oil prices will most likely weigh on the index due to the negative impact on consumer behavior. On the other hand, the positives, at least temporarily, could be higher profits in the energy sector, along with employment to that region. We simply need to have more time pass to see which of the possibilities will materialize.
One analyst opined that “we could start expecting a negative impact from oil on the S&P 500 in an $80-85 range for WTI,” which means we have a long way to go from the current $61 level.
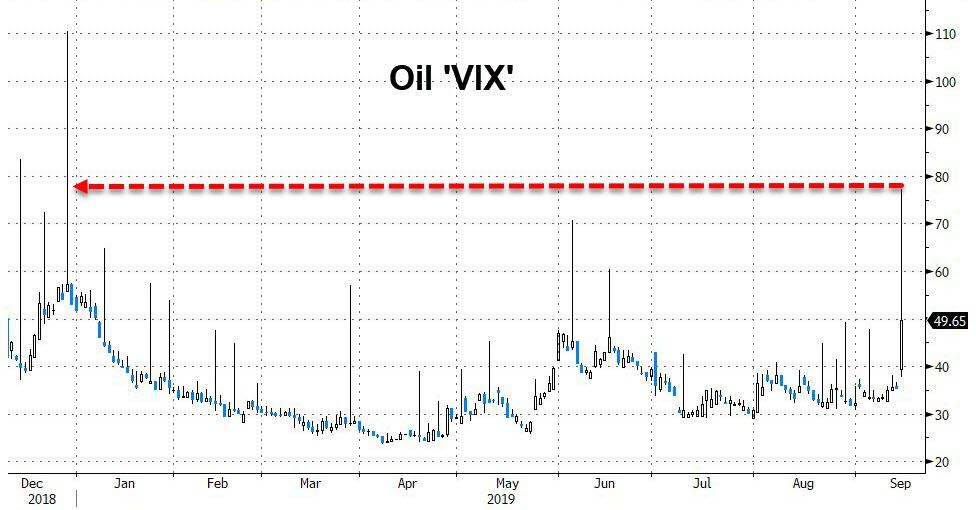
Bond yields acted as a safety haven with the 10-year dropping over 5 basis points to settle at 1.845%, while the oil volatility index surged to its highest since late 2018.
So far, the effect on equities was minor, and we’ll have to wait and see how this movie plays out.
2. ETFs in the Spotlight
In case you missed the announcement and description of this section, you can read it here again.
It features 10 broadly diversified and sector ETFs from my HighVolume list as posted every Saturday. Furthermore, they are screened for the lowest MaxDD% number meaning they have been showing better resistance to temporary sell offs than all others over the past year.
The below table simply demonstrates the magnitude with which some of the ETFs are fluctuating regarding their positions above or below their respective individual trend lines (%+/-M/A). A break below, represented by a negative number, shows weakness, while a break above, represented by a positive percentage, shows strength.
For hundreds of ETF choices, be sure to reference Thursday’s StatSheet.
For this current domestic “Buy” cycle, here’s how some our candidates have fared:
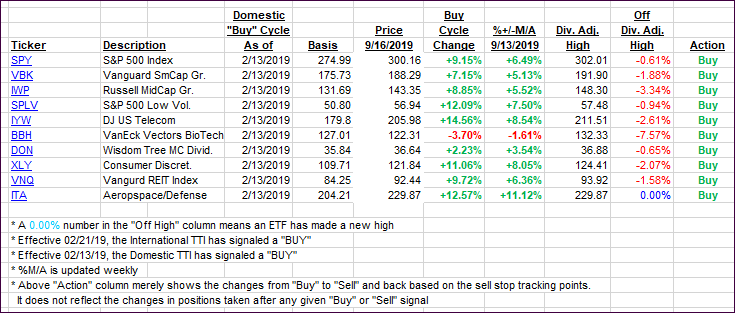
Again, the %+/-M/A column above shows the position of the various ETFs in relation to their respective long-term trend lines, while the trailing sell stops are being tracked in the “Off High” column. The “Action” column will signal a “Sell” once the -8% point has been taken out in the “Off High” column. For more volatile sector ETFs, the trigger point is -10%.
3. Trend Tracking Indexes (TTIs)
Our Trend Tracking Indexes (TTIs) were mixed again with the Domestic one gaining, while the International one retreated.
Here’s how we closed 09/16/2019:
Domestic TTI: +6.13% above its M/A (prior close +6.05%)—Buy signal effective 02/13/2019
International TTI: +2.92% above its M/A (prior close +3.46%)—Buy signal effective 09/12/2019
Disclosure: I am obliged to inform you that I, as well as my advisory clients, own some of the ETFs listed in the above table. Furthermore, they do not represent a specific investment recommendation for you, they merely show which ETFs from the universe I track are falling within the specified guidelines.
Contact Ulli