
- Moving the markets
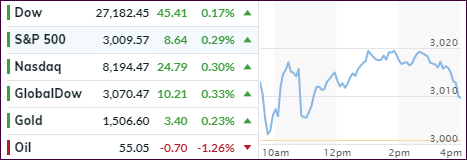
An early rally ended up running out of steam and might have even produced a red close, but fortunately, we ran out of trading time.
The initial boost came from Europe, as the European Central Bank (ECB) followed through on hopes that they’d dig into their toolbox and cut the deposit rate further into negative territory. At the same time, they launched a new round of monthly bond purchases (for as long as needed), here in the US known as Quantitative Easing (QE), along with other steps to stimulate the sagging eurozone economies.
Outgoing ECB head Draghi justified this action by saying that “risks to the eurozone outlook had increased” due to the ongoing global trade disagreements along with concerns about the impending UK exit from the EU.
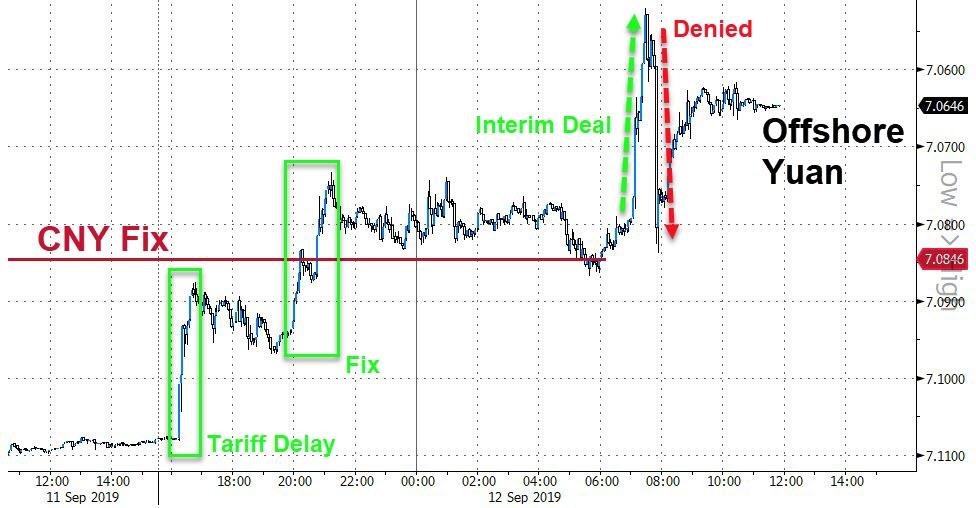
Another round of trade jawboning with the Chinese played havoc with the indexes, as early news of an “interim deal” pushed equities higher, which then lost stream in the end, as the White House announced that such a deal was “absolutely not” on the table.
This session had the feel of no clear direction, as the latest headlines about assurances, leakages and skirmishes produced nothing but a roller coaster day. However, we did manage to close in the green. ZH produced this spot-on chart clearly depicting the chaos that went on behind the scenes.
Things may heat up even more, as we inch closer to next week’s Fed meeting and its verdict on interest rates.
2. ETFs in the Spotlight
In case you missed the announcement and description of this section, you can read it here again.
It features 10 broadly diversified and sector ETFs from my HighVolume list as posted every Saturday. Furthermore, they are screened for the lowest MaxDD% number meaning they have been showing better resistance to temporary sell offs than all others over the past year.
The below table simply demonstrates the magnitude with which some of the ETFs are fluctuating regarding their positions above or below their respective individual trend lines (%+/-M/A). A break below, represented by a negative number, shows weakness, while a break above, represented by a positive percentage, shows strength.
For hundreds of ETF choices, be sure to reference Thursday’s StatSheet.
For this current domestic “Buy” cycle, here’s how some our candidates have fared:
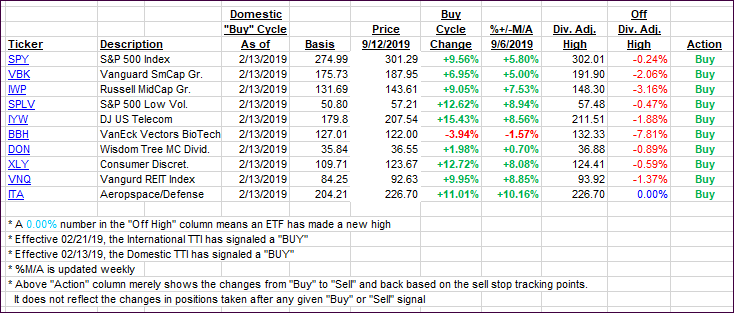
Again, the %+/-M/A column above shows the position of the various ETFs in relation to their respective long-term trend lines, while the trailing sell stops are being tracked in the “Off High” column. The “Action” column will signal a “Sell” once the -8% point has been taken out in the “Off High” column. For more volatile sector ETFs, the trigger point is -10%.
3. Trend Tracking Indexes (TTIs)
Our Trend Tracking Indexes (TTIs) crept higher, as a rollercoaster ride managed to end up in the green.
Here’s how we closed 09/12/2019:
Domestic TTI: +6.43% above its M/A (prior close +6.31%)—Buy signal effective 02/13/2019
International TTI: +3.21% above its M/A (prior close +2.87%)—Buy signal effective 09/12/2019
Disclosure: I am obliged to inform you that I, as well as my advisory clients, own some of the ETFs listed in the above table. Furthermore, they do not represent a specific investment recommendation for you, they merely show which ETFs from the universe I track are falling within the specified guidelines.
Contact Ulli