
- Moving the markets
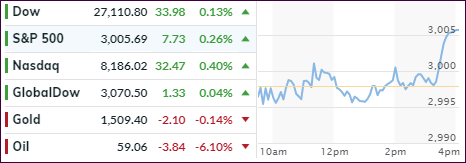
It was a matter of treading water for most of the day, with the major indexes limping around their respective unchanged lines, until a last-minute pump pushed the indices up and into a green close.
Mid-day attempts to get a rally going fell short, as weakness in the energy sector, due to reports that Saudi Arabia may recover sooner than expected, pulled oil off its lofty level. According to Reuters, Saudi Arabia will restore 70% of the 5.7 million barrels a day production lost rather quickly and the balance within the next two to three weeks.
If so, yesterday’s crude oil spike will turn out to be an outlier with no consequences to equity markets. Traders seemed to share that view and quickly focused their attention on the Fed and expectations that they would reduce interest rates when they meet tomorrow.
It is a foregone conclusion that a -0.25% ease is priced in the market, although the whisper number of -0.5% is still making the rounds. One thing is for sure, if the Fed does not deliver a rate cut, equities will sell off sharply. Remember, these markets are like a drug addict that does not function very well without a regular dose of stimulus.
ZH summed it up this way:
Tomorrow’s rate cut will come with full employment, surging inflation, record high stock prices, and near record low interest rates.
Makes me want to go “Hmmm.”
2. ETFs in the Spotlight
In case you missed the announcement and description of this section, you can read it here again.
It features 10 broadly diversified and sector ETFs from my HighVolume list as posted every Saturday. Furthermore, they are screened for the lowest MaxDD% number meaning they have been showing better resistance to temporary sell offs than all others over the past year.
The below table simply demonstrates the magnitude with which some of the ETFs are fluctuating regarding their positions above or below their respective individual trend lines (%+/-M/A). A break below, represented by a negative number, shows weakness, while a break above, represented by a positive percentage, shows strength.
For hundreds of ETF choices, be sure to reference Thursday’s StatSheet.
For this current domestic “Buy” cycle, here’s how some our candidates have fared:
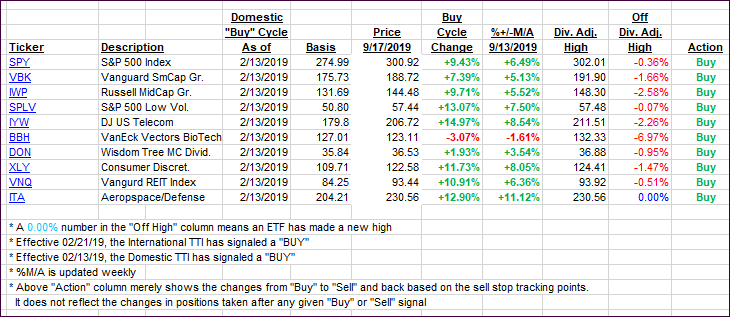
Again, the %+/-M/A column above shows the position of the various ETFs in relation to their respective long-term trend lines, while the trailing sell stops are being tracked in the “Off High” column. The “Action” column will signal a “Sell” once the -8% point has been taken out in the “Off High” column. For more volatile sector ETFs, the trigger point is -10%.
3. Trend Tracking Indexes (TTIs)
Our Trend Tracking Indexes (TTIs) changed only immaterially.
Here’s how we closed 09/17/2019:
Domestic TTI: +6.15% above its M/A (prior close +6.13%)—Buy signal effective 02/13/2019
International TTI: +2.97% above its M/A (prior close +2.92%)—Buy signal effective 09/12/2019
Disclosure: I am obliged to inform you that I, as well as my advisory clients, own some of the ETFs listed in the above table. Furthermore, they do not represent a specific investment recommendation for you, they merely show which ETFs from the universe I track are falling within the specified guidelines.
Contact Ulli