
- Moving the markets
As expected, the Fed delivered the goods and cut rates by 0.25%; but stocks sold off. The reason was that the accompanying language in its statement and economic projections cast doubt not only on another rate cut this year but also in 2020. That was a disappointment for traders, who had firmly believed that at least one more reduction prior to December 11 was a sure thing.
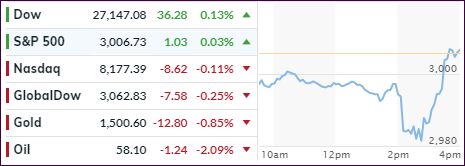
However, the sell-off was mild, and we saw another last hour pump to get the indexes to a green close, which worked except for the Nasdaq. In the end, not much was lost or gained, as we ended up hugging the unchanged line.
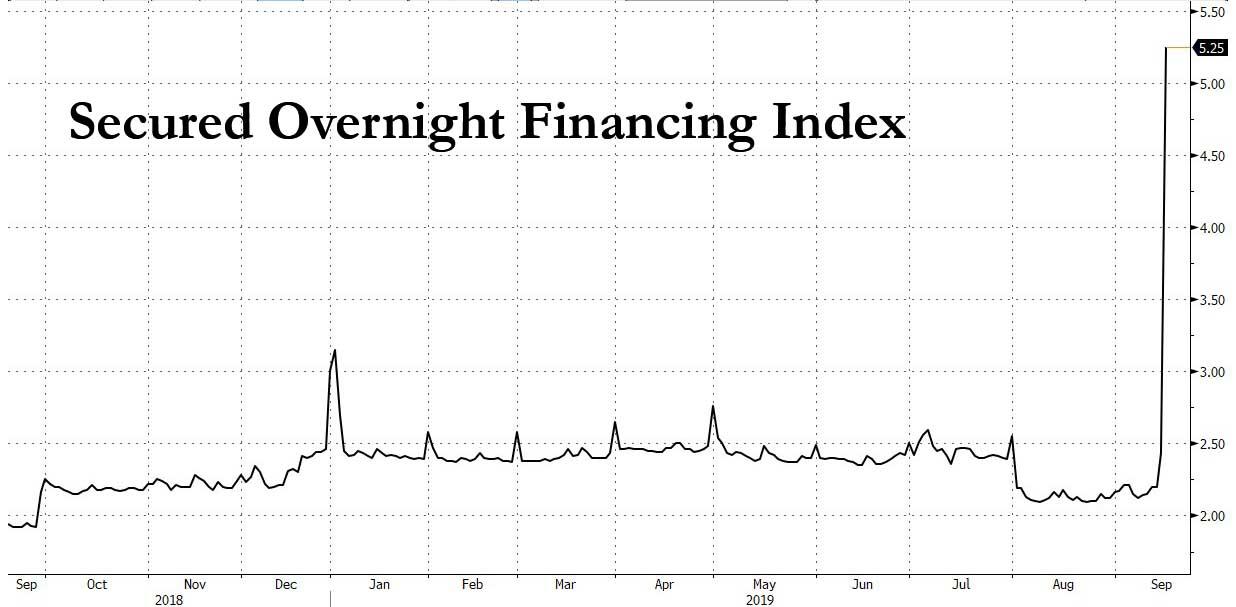
What was not addressed was the liquidity crunch in the overnight lending market, where the Fed had to step in and provide some $75 billion in liquidity as the Secured Overnight Financing Index (SOFI) spiked to 5.25% from 2.25%. This was the Fed’s first intervention in over 10 years.
These are complicated repo transactions, which can have a dire effect on equities but have not been reported by MSM. If this topic interests you, you can read more here and here. I am merely pointing this out as a fact that has been conveniently ignored by the markets but may come back to haunt them.
The last hour rebound was a function of Fed head Powell promising more Quantitative Easing (QE) by disguising his words like this:
“It is certainly a possibility that we’ll need to resume the organic growth of the balance sheet sooner than we thought.”
What that means is that QE is on its way, at some point, but stocks managed to joyfully jump into the close with the S&P 500 reclaiming its recently lost 3k milestone marker.
The Fed did exactly what was expected, but it remains to be seen if this will be enough for equities to continue climbing the mountain towards new all-time highs.
2. ETFs in the Spotlight
In case you missed the announcement and description of this section, you can read it here again.
It features 10 broadly diversified and sector ETFs from my HighVolume list as posted every Saturday. Furthermore, they are screened for the lowest MaxDD% number meaning they have been showing better resistance to temporary sell offs than all others over the past year.
The below table simply demonstrates the magnitude with which some of the ETFs are fluctuating regarding their positions above or below their respective individual trend lines (%+/-M/A). A break below, represented by a negative number, shows weakness, while a break above, represented by a positive percentage, shows strength.
For hundreds of ETF choices, be sure to reference Thursday’s StatSheet.
For this current domestic “Buy” cycle, here’s how some our candidates have fared:
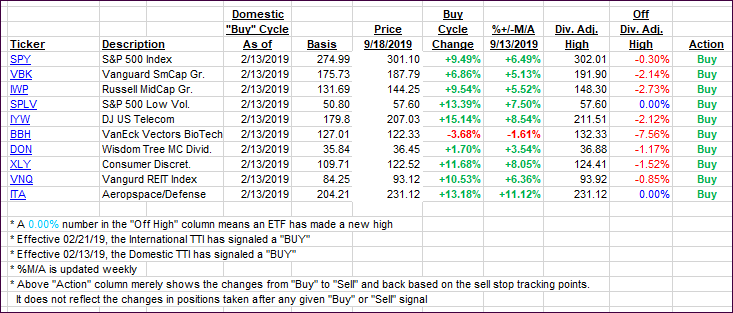
Again, the %+/-M/A column above shows the position of the various ETFs in relation to their respective long-term trend lines, while the trailing sell stops are being tracked in the “Off High” column. The “Action” column will signal a “Sell” once the -8% point has been taken out in the “Off High” column. For more volatile sector ETFs, the trigger point is -10%.
3. Trend Tracking Indexes (TTIs)
Our Trend Tracking Indexes (TTIs) again changed only immaterially.
Here’s how we closed 09/18/2019:
Domestic TTI: +6.03% above its M/A (prior close +6.15%)—Buy signal effective 02/13/2019
International TTI: +2.67% above its M/A (prior close +2.97%)—Buy signal effective 09/12/2019
Disclosure: I am obliged to inform you that I, as well as my advisory clients, own some of the ETFs listed in the above table. Furthermore, they do not represent a specific investment recommendation for you, they merely show which ETFs from the universe I track are falling within the specified guidelines.
Contact Ulli