
ETF Tracker StatSheet
You can view the latest version here.
SHRUGGING OFF A POOR JOBS REPORT
- Moving the markets
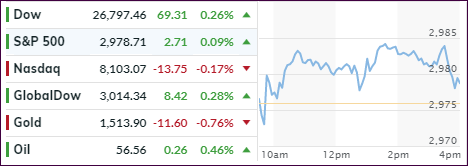
Today’s jobs report came in weaker than expected, as only 130k jobs were created in August vs. a hoped for 170k. Stocks shrugged off the poor number with traders and algos alike seeing the positive in increased odds that the Fed will indeed cut rates (maybe even the whisper number of 0.5%?) when it meets in 2 weeks.
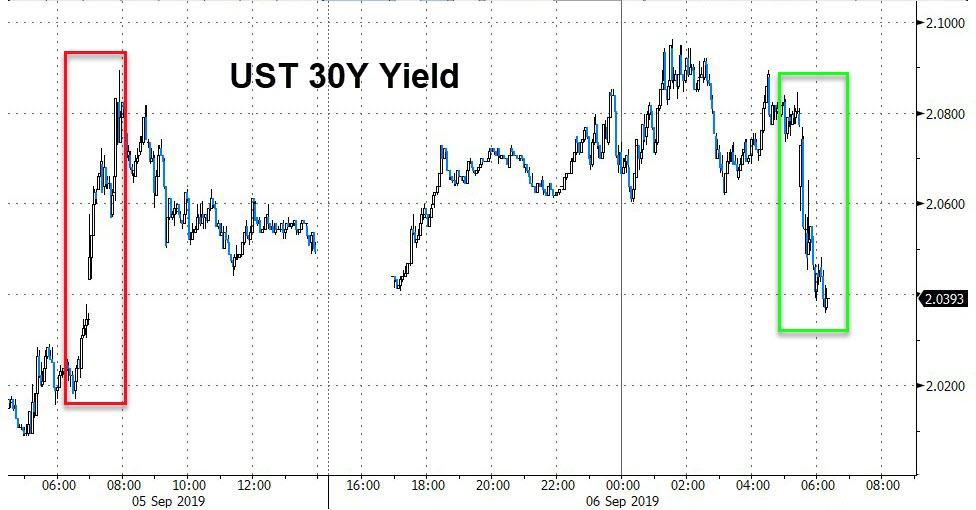
As a consequence, bond yields dropped, after spiking yesterday, while the dollar dumped and reached a level that was a starting point for Thursday’s rally. In other words, nothing was gained.
The mid-day rebound lost steam in the end with the S&P 500 barely hanging on to a green close, while the Nasdaq slipped slightly into the red. Still, for the week, the S&P eked out a gain of some +1.8%.
Trying to keep things calm were words from Fed head Powell, who said that “he is not forecasting or expecting a recession,” though he sees “significant” downside risks that the Central Bank will monitor.
Interestingly, as ZH posted, since the last Fed rate-cut, the US dollar and stocks are unchanged, while bonds and gold are up some 6%, as this chart shows.
Hmm, does that mean rate cuts are no longer providing the fire power to support stocks? We’ll find out after the next Fed meeting if this proposition holds true.
2. ETFs in the Spotlight
In case you missed the announcement and description of this section, you can read it here again.
It features 10 broadly diversified and sector ETFs from my HighVolume list as posted every Saturday. Furthermore, they are screened for the lowest MaxDD% number meaning they have been showing better resistance to temporary sell offs than all others over the past year.
The below table simply demonstrates the magnitude with which some of the ETFs are fluctuating regarding their positions above or below their respective individual trend lines (%+/-M/A). A break below, represented by a negative number, shows weakness, while a break above, represented by a positive percentage, shows strength.
For hundreds of ETF choices, be sure to reference Thursday’s StatSheet.
For this current domestic “Buy” cycle, here’s how some our candidates have fared:
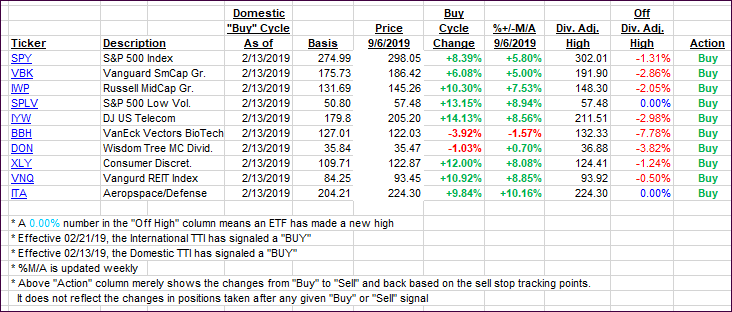
Again, the %+/-M/A column above shows the position of the various ETFs in relation to their respective long-term trend lines, while the trailing sell stops are being tracked in the “Off High” column. The “Action” column will signal a “Sell” once the -8% point has been taken out in the “Off High” column. For more volatile sector ETFs, the trigger point is -10%.
3. Trend Tracking Indexes (TTIs)
Our Trend Tracking Indexes (TTIs) changed only slightly. The International one is remaining above its trendline, but since this is only its 3rd day above, we need to see more staying power before considering the current ‘Sell’ signal to be over.
Here’s how we closed 09/06/2019:
Domestic TTI: +4.44% above its M/A (prior close +4.50%)—Buy signal effective 02/13/2019
International TTI: +1.33% above its M/A (prior close +1.20%)—Sell signal effective 08/15/2019
Disclosure: I am obliged to inform you that I, as well as my advisory clients, own some of the ETFs listed in the above table. Furthermore, they do not represent a specific investment recommendation for you, they merely show which ETFs from the universe I track are falling within the specified guidelines.
———————————————————-
WOULD YOU LIKE TO HAVE YOUR INVESTMENTS PROFESSIONALLY MANAGED?
Do you have the time to follow our investment plans yourself? If you are a busy professional who would like to have his portfolio managed using our methodology, please contact me directly or get more details here.
———————————————————
Back issues of the ETF Tracker are available on the web.
Contact Ulli