
- Moving the markets
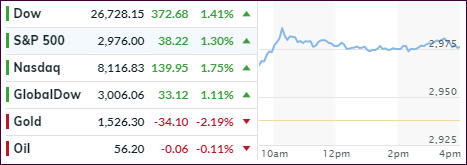
Just when you thought the trade deal was dead, news that US and Chinese officials declared a tentative resumption of tariff talks made the headlines, and off to the races we went with the computer algos pushing the indexes sharply higher.
Mind you that nothing worthwhile was accomplished. The warring parties simply agreed to talk again around “early October,” which these days is considered enough of a progress in the yearlong trade conflict for equities to surge.
To be fair, bullish sentiment was boosted by a couple of economic reports. First, ADP estimated that the private sector added some 195k jobs in August, which raised expectations for a good number tomorrow when the BLS releases its jobs report.
Second, despite recent surveys pointing to weakness in the manufacturing sector, the ISM rebounded, even though 60% of its components weakened. Nevertheless, for the day, the markets treated ‘good news’ as ‘good news’ with equities spiking.
That spike came in the face of sharply surging bond yields with the 30-year heading back above 2%, while the benchmark 10-year dashed 10 basis points to 1.58% before pulling back into the close.
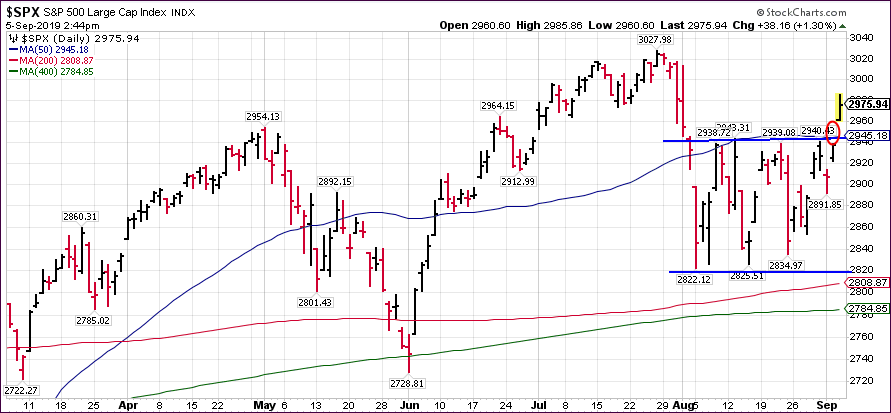
The S&P 500 broke out of its 5-week trading range (upper blue line) leaving a break-away gap behind (red circle). This gap will need to be closed at some point, so it’s questionable at this moment in time whether this breakout has enough legs to take out July’s highs.
This strong up move in the face of dramatically rising bond yields is unusual and, while this push benefited the S&P 500, it’s low volatility cousin SPLV, which I have preferred during this ‘Buy’ cycle, lagged and did not participate.
This means for this current cycle, which started on 2/13/19, the S&P 500 (SPY) has made up some ground and is now showing an +8.28% gain, which is still substantially behind the SPLV’s +12.89%.
Tomorrow’s jobs numbers are bound to affect market direction. The question is “which way?”
2. ETFs in the Spotlight
In case you missed the announcement and description of this section, you can read it here again.
It features 10 broadly diversified and sector ETFs from my HighVolume list as posted every Saturday. Furthermore, they are screened for the lowest MaxDD% number meaning they have been showing better resistance to temporary sell offs than all others over the past year.
The below table simply demonstrates the magnitude with which some of the ETFs are fluctuating regarding their positions above or below their respective individual trend lines (%+/-M/A). A break below, represented by a negative number, shows weakness, while a break above, represented by a positive percentage, shows strength.
For hundreds of ETF choices, be sure to reference Thursday’s StatSheet.
For this current domestic “Buy” cycle, here’s how some our candidates have fared:
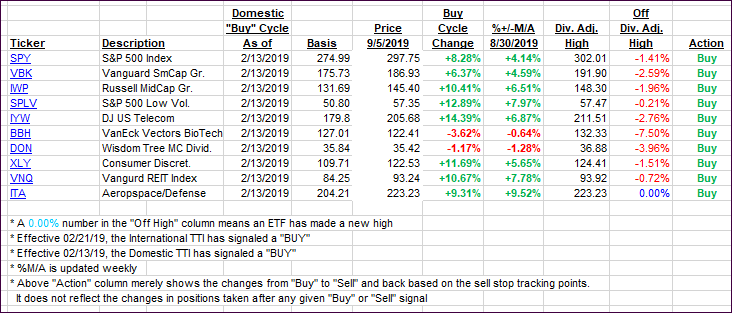
Again, the %+/-M/A column above shows the position of the various ETFs in relation to their respective long-term trend lines, while the trailing sell stops are being tracked in the “Off High” column. The “Action” column will signal a “Sell” once the -8% point has been taken out in the “Off High” column. For more volatile sector ETFs, the trigger point is -10%.
3. Trend Tracking Indexes (TTIs)
Our Trend Tracking Indexes (TTIs) closed sharply higher with the International one moving above its long-term trend line. As posted before, I need to see more staying power before issuing a new ‘Buy’ for this arena
Here’s how we closed 09/05/2019:
Domestic TTI: +4.50% above its M/A (prior close +2.99%)—Buy signal effective 02/13/2019
International TTI: +1.20% above its M/A (prior close +0.09%)—Sell signal effective 08/15/2019
Disclosure: I am obliged to inform you that I, as well as my advisory clients, own some of the ETFs listed in the above table. Furthermore, they do not represent a specific investment recommendation for you, they merely show which ETFs from the universe I track are falling within the specified guidelines.
Contact Ulli