
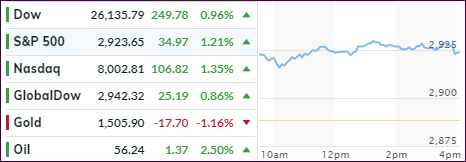
- Moving the markets
Friday’s rebound did not die today but continued full force thanks to Trump’s successful jawboning about the trade talks. It was more of a concession towards the Chinese telecom giant Huawei, which received a 90-day reprieve, during which it can continue to do business with American companies without needing a case-by-case license.
Reports that Germany may be considering stimulus measures, to pull up their sagging economy, helped the global mood and supported equities for that region. Again, fiscal recklessness is always a positive for equities.
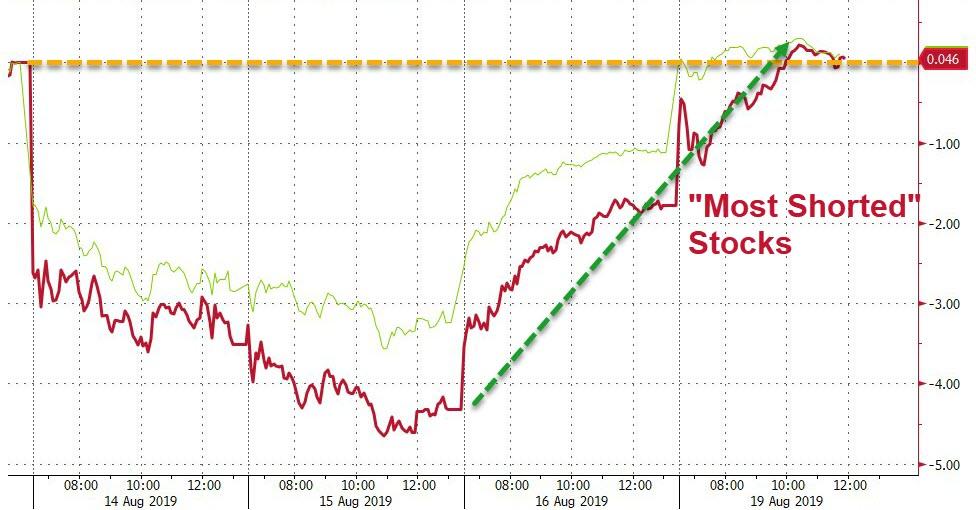
Another big assist came from a giant short squeeze, the biggest in 7 months, which started on Friday and kept bulls happy for the past 2 trading days, as all of last week’s losses have now been recovered.
In the end, despite slightly rising bond yields, the mission was accomplished, and the S&P 500 is now less than 2% away from going green for the month.
2. ETFs in the Spotlight
In case you missed the announcement and description of this section, you can read it here again.
It features 10 broadly diversified and sector ETFs from my HighVolume list as posted every Saturday. Furthermore, they are screened for the lowest MaxDD% number meaning they have been showing better resistance to temporary sell offs than all others over the past year.
The below table simply demonstrates the magnitude with which some of the ETFs are fluctuating regarding their positions above or below their respective individual trend lines (%+/-M/A). A break below, represented by a negative number, shows weakness, while a break above, represented by a positive percentage, shows strength.
For hundreds of ETF choices, be sure to reference Thursday’s StatSheet.
For this current domestic “Buy” cycle, here’s how some our candidates have fared:
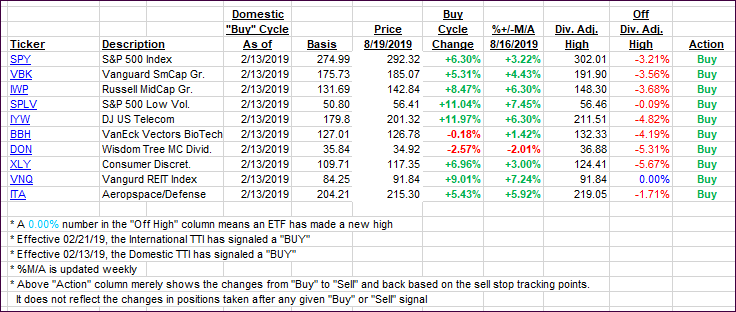
Again, the %+/-M/A column above shows the position of the various ETFs in relation to their respective long-term trend lines, while the trailing sell stops are being tracked in the “Off High” column. The “Action” column will signal a “Sell” once the -8% point has been taken out in the “Off High” column. For more volatile sector ETFs, the trigger point is -10%.
3. Trend Tracking Indexes (TTIs)
Our Trend Tracking Indexes (TTIs) jumped with the International one making headway as well but remains below its long-term trend line.
Here’s how we closed 08/19/2019:
Domestic TTI: +2.76% above its M/A (prior close +1.59%)—Buy signal effective 02/13/2019
International TTI: -0.89% below its M/A (prior close -1.56%)—Sell signal effective 08/15/2019
Disclosure: I am obliged to inform you that I, as well as my advisory clients, own some of the ETFs listed in the above table. Furthermore, they do not represent a specific investment recommendation for you, they merely show which ETFs from the universe I track are falling within the specified guidelines.
Contact Ulli