- Moving the markets
Sometimes you just have to laugh out load. Today was such a day, as data showing that US Manufacturing dropped to its weakest in 10 years, or more specifically since September 2009. One analyst suggested that the goods producing sector is “on course to act as a significant drag on the economy in the third quarter.”
That is truly terrible news, but it was greeted on Wall Street as “terrific” with the major indexes staging a huge rebound, after yesterday’s drubbing, with the Dow being up at one point over 300 points.
Then came unexpected “bad news 2.0” in the form of Trump’s announcement that he will add a 10% tariff on the remaining $300 billion of Chinese imports starting in September.
That caused an instant trend reversal, and the major indexes dove south with the Dow at one point being down over 300 points. All gains evaporated within minutes, while the 10-year bond yield also did its best swan dive imitation by reaching a yield that is now below the Trump election lows.
That caused the “jaws of death,” as ZH termed it, first to widen and then to narrow. In case you missed it, they simply represent a divergence between the 10-year yield and the S&P 500, which sooner or later will have to “normalize.” The question remains whether it will be via a crash in the S&P or a hike in bond yields or a combination of both.
Will history repeat itself as this chart comparison to 1987 seems to indicate? Only time will tell, but it’s good to have an exit strategy; just in case.
2. ETFs in the Spotlight
In case you missed the announcement and description of this section, you can read it here again.
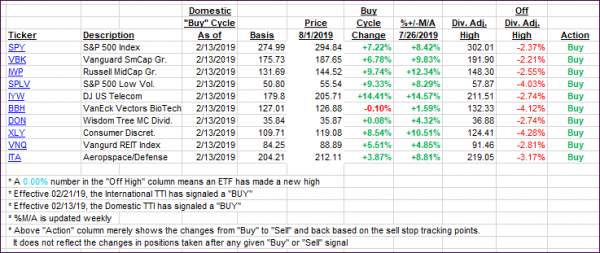
It features 10 broadly diversified and sector ETFs from my HighVolume list as posted every Saturday. Furthermore, they are screened for the lowest MaxDD% number meaning they have been showing better resistance to temporary sell offs than all others over the past year.
The below table simply demonstrates the magnitude with which some of the ETFs are fluctuating regarding their positions above or below their respective individual trend lines (%+/-M/A). A break below, represented by a negative number, shows weakness, while a break above, represented by a positive percentage, shows strength.
For hundreds of ETF choices, be sure to reference Thursday’s StatSheet.
For this current domestic “Buy” cycle, here’s how some our candidates have fared:

Again, the %+/-M/A column above shows the position of the various ETFs in relation to their respective long-term trend lines, while the trailing sell stops are being tracked in the “Off High” column. The “Action” column will signal a “Sell” once the -8% point has been taken out in the “Off High” column. For more volatile sector ETFs, the trigger point is -10%.
3. Trend Tracking Indexes (TTIs)
Our Trend Tracking Indexes (TTIs) retreated as a wild whip-saw in the markets favored the bears.
Here’s how we closed 08/01/2019:
Domestic TTI: +5.20% above its M/A (last close +6.56%)—Buy signal effective 02/13/2019
International TTI: +2.74% above its M/A (last close +3.11%)—Buy signal effective 06/19/2019
Disclosure: I am obliged to inform you that I, as well as my advisory clients, own some of the ETFs listed in the above table. Furthermore, they do not represent a specific investment recommendation for you, they merely show which ETFs from the universe I track are falling within the specified guidelines.
Contact Ulli