
- Moving the markets
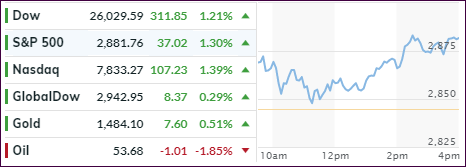
While the initial morning rebound faded mid-day, buyers stepped in subsequently and pushed the major indexes out of the doldrums and into a solid green close.
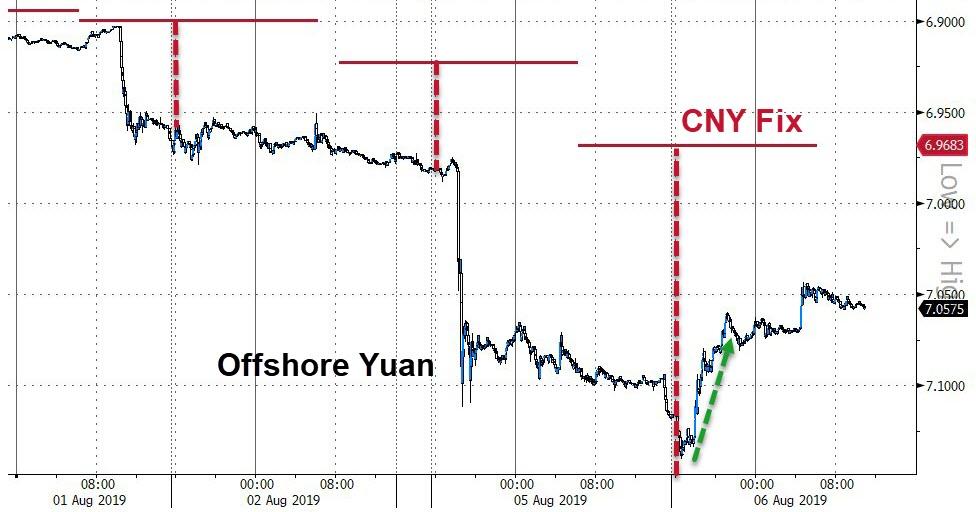
Helping matters was China stabilizing the problem child that caused yesterday’s panic selling, namely the Juan. The PBOC (China’s main bank) fixed the Juan at 6.9683 per dollar, which was marginally stronger than the 7.00 “red line in the sand.”
That reduced downside market pressures with traders finally being able to steady their nerves after the Dow’s 767-point plunge. The mood, however, remains fragile, as Wall Street participants are keenly aware that a stray headline or misunderstood presidential tweet could kick market turmoil back into high gear.
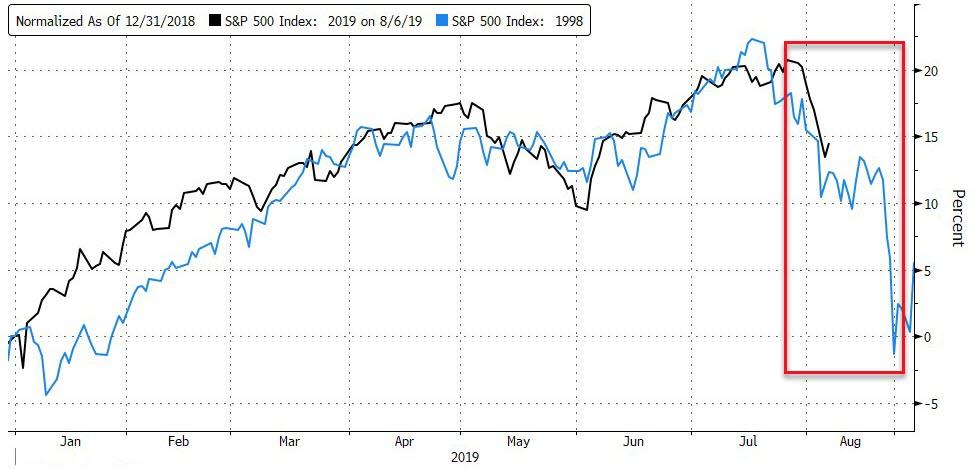
When looking at this updated chart demonstrating the similarities between the 2019 and 1998 S&P 500 performance, you have to admit that it is eerily similar. This is not to say that history will repeat itself but, so far, it seems to be a possibility.
2. ETFs in the Spotlight
In case you missed the announcement and description of this section, you can read it here again.
It features 10 broadly diversified and sector ETFs from my HighVolume list as posted every Saturday. Furthermore, they are screened for the lowest MaxDD% number meaning they have been showing better resistance to temporary sell offs than all others over the past year.
The below table simply demonstrates the magnitude with which some of the ETFs are fluctuating regarding their positions above or below their respective individual trend lines (%+/-M/A). A break below, represented by a negative number, shows weakness, while a break above, represented by a positive percentage, shows strength.
For hundreds of ETF choices, be sure to reference Thursday’s StatSheet.
For this current domestic “Buy” cycle, here’s how some our candidates have fared:
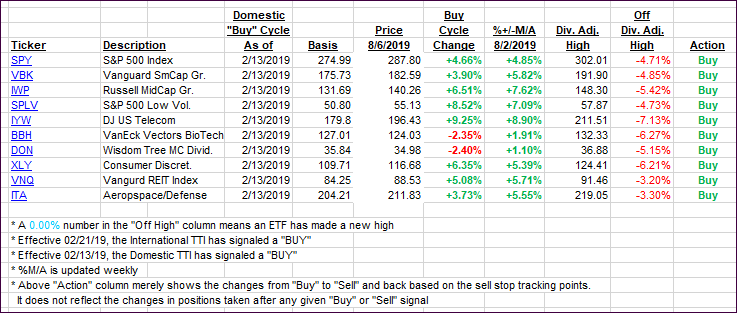
Again, the %+/-M/A column above shows the position of the various ETFs in relation to their respective long-term trend lines, while the trailing sell stops are being tracked in the “Off High” column. The “Action” column will signal a “Sell” once the -8% point has been taken out in the “Off High” column. For more volatile sector ETFs, the trigger point is -10%.
3. Trend Tracking Indexes (TTIs)
Our Trend Tracking Indexes (TTIs) recovered with the relief rally, but the International remains below its trend line. I will wait for further confirmation before declaring this ‘Buy’ cycle to be over.
Here’s how we closed 08/06/2019:
Domestic TTI: +2.32% above its M/A (prior close +1.19%)—Buy signal effective 02/13/2019
International TTI: -0.86% above its M/A (prior close -1.15%)—Buy signal effective 06/19/2019
Disclosure: I am obliged to inform you that I, as well as my advisory clients, own some of the ETFs listed in the above table. Furthermore, they do not represent a specific investment recommendation for you, they merely show which ETFs from the universe I track are falling within the specified guidelines.
Contact Ulli