
- Moving the markets
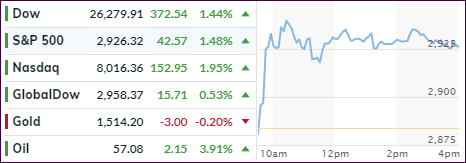
Again, it was a trading day that had me shaking my head. After yesterday’s drubbing, with the Dow losing close to 400 points, an explosive rebound sent the major indexes back into rally mode wiping out just about all of yesterday’s losses.
It was a headline, that the speed-reading computer algos interpreted as an incredibly positive event regarding the US-China trade dispute. The statement that caused this violent bullish reaction was this one:
…some tariffs will take effect on Sept. 1 as planned, “certain products are being removed from the tariff list based on health, safety, national security and other factors and will not face additional tariffs of 10 percent,” the U.S. Trade Representative’s offices said in a statement Tuesday.
“Further, as part of USTR’s public comment and hearing process, it was determined that the tariff should be delayed to December 15 for certain articles,” the statement continued.
“Products in this group include, for example, cell phones, laptop computers, video game consoles, certain toys, computer monitors, and certain items of footwear and clothing.”
In other words, tariffs will go ahead on September 1st but tariffs on some products will be delayed until December 15 on the basis of health, safety and national security.
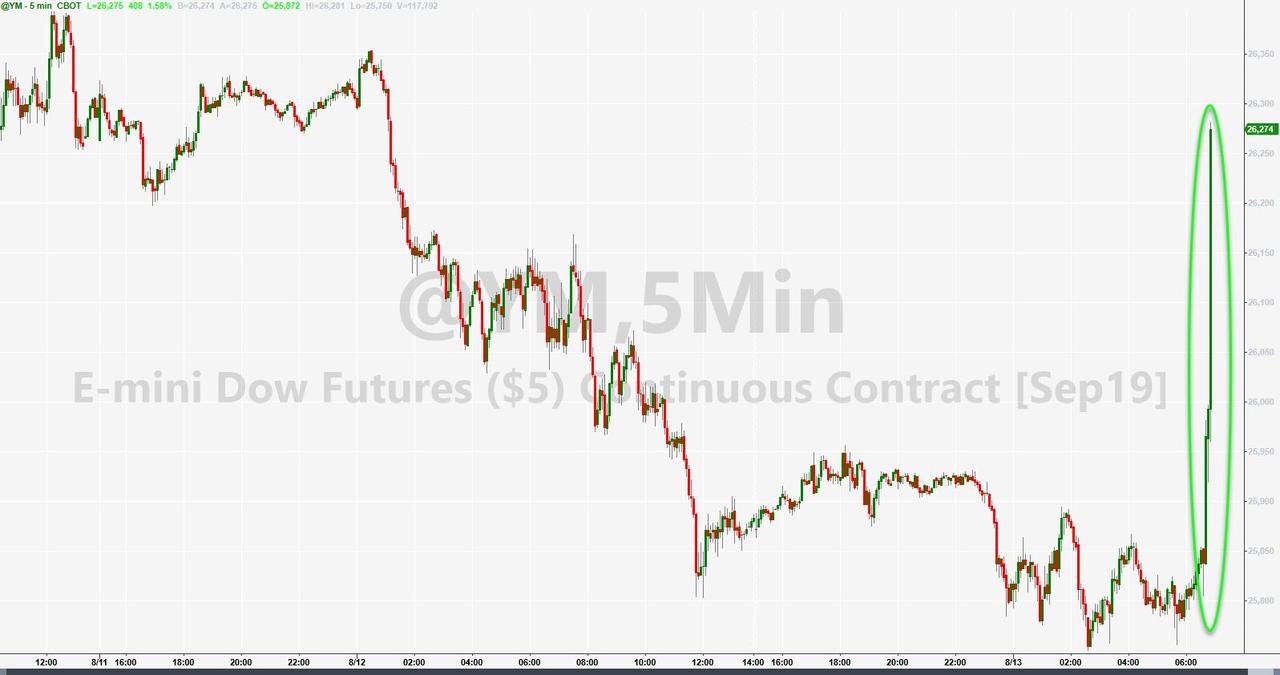
It looks like the algos only saw “delay” and “December 15” and the bidding war was on. If you think that this is ridiculous, you are correct, but this is the insane market environment we are living in.
In the end, the S&P 500 ended up close to where we left off on Friday with nothing gained but also nothing lost. It promises to be a hot August, as global/trade uncertainties will continue to affect volatility and market direction.
2. ETFs in the Spotlight
In case you missed the announcement and description of this section, you can read it here again.
It features 10 broadly diversified and sector ETFs from my HighVolume list as posted every Saturday. Furthermore, they are screened for the lowest MaxDD% number meaning they have been showing better resistance to temporary sell offs than all others over the past year.
The below table simply demonstrates the magnitude with which some of the ETFs are fluctuating regarding their positions above or below their respective individual trend lines (%+/-M/A). A break below, represented by a negative number, shows weakness, while a break above, represented by a positive percentage, shows strength.
For hundreds of ETF choices, be sure to reference Thursday’s StatSheet.
For this current domestic “Buy” cycle, here’s how some our candidates have fared:
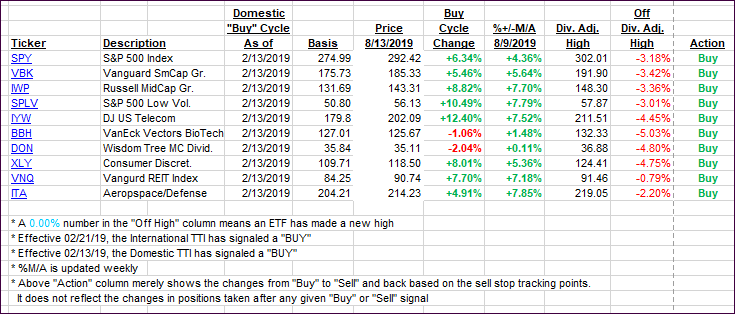
Again, the %+/-M/A column above shows the position of the various ETFs in relation to their respective long-term trend lines, while the trailing sell stops are being tracked in the “Off High” column. The “Action” column will signal a “Sell” once the -8% point has been taken out in the “Off High” column. For more volatile sector ETFs, the trigger point is -10%.
3. Trend Tracking Indexes (TTIs)
Our Trend Tracking Indexes (TTIs) recovered, as the major indexes bounced back for the time being. The International TTI is still stuck slightly below its long-term trend line but by not enough of a margin to call an end to this current bullish cycle.
Here’s how we closed 08/13/2019:
Domestic TTI: +3.21% above its M/A (prior close +1.90%)—Buy signal effective 02/13/2019
International TTI: -0.36% below its M/A (prior close -0.88%)—Buy signal effective 06/19/2019
Disclosure: I am obliged to inform you that I, as well as my advisory clients, own some of the ETFs listed in the above table. Furthermore, they do not represent a specific investment recommendation for you, they merely show which ETFs from the universe I track are falling within the specified guidelines.
Contact Ulli