

- Moving the markets
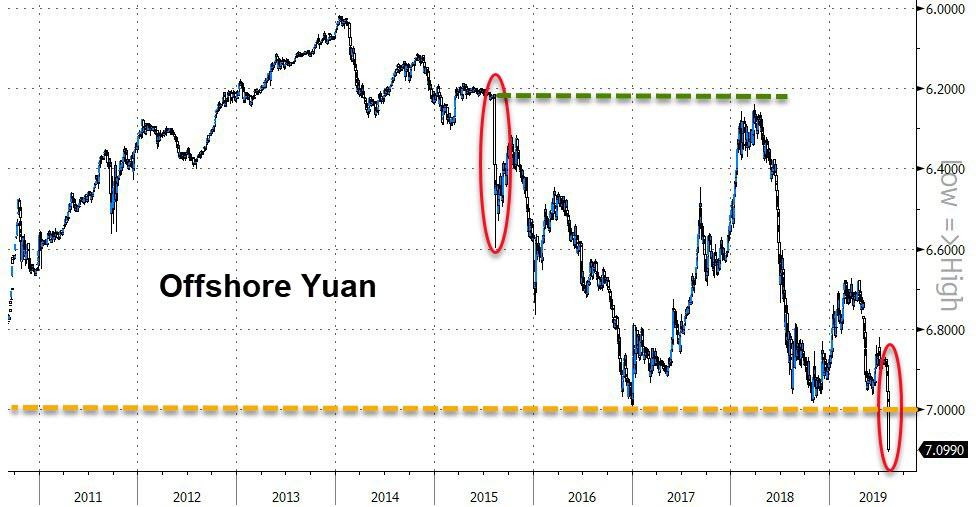
The basic law of physics tells us that any ‘action’ is followed by an equal or greater ‘reaction.’ This became very clear today when, after Trump’s threat of additional tariffs last week, the Chinese retaliated by letting their currency, the Juan, float freely by removing the US dollar peg.
The Juan dropped to 10-year low causing equities around the word to freefall with the Dow being down at one point over 850 points. No one saw this coming, as analysts were of the opinion last week that trade tensions with China existed but that neither side was ready to escalate.
That was an incorrect assumption, as it now appears that the final nail was put in the trade coffin, unless one of the warring parties comes back to the negotiating table with major concessions. I don’t see that happen, at least not in the foreseeable future.
Trump took the opportunity to call out China and continued to push the Fed for lower rates with tweets like this:
China dropped the price of their currency to an almost a historic low. It’s called “currency manipulation.” Are you listening Federal Reserve? This is a major violation which will greatly weaken China over time!
What a difference a week can make, during which we went from ‘all is fine, new all-time highs and a goldilocks scenario’ to all hell breaking loose with the bears suddenly having outwitted the bulls.
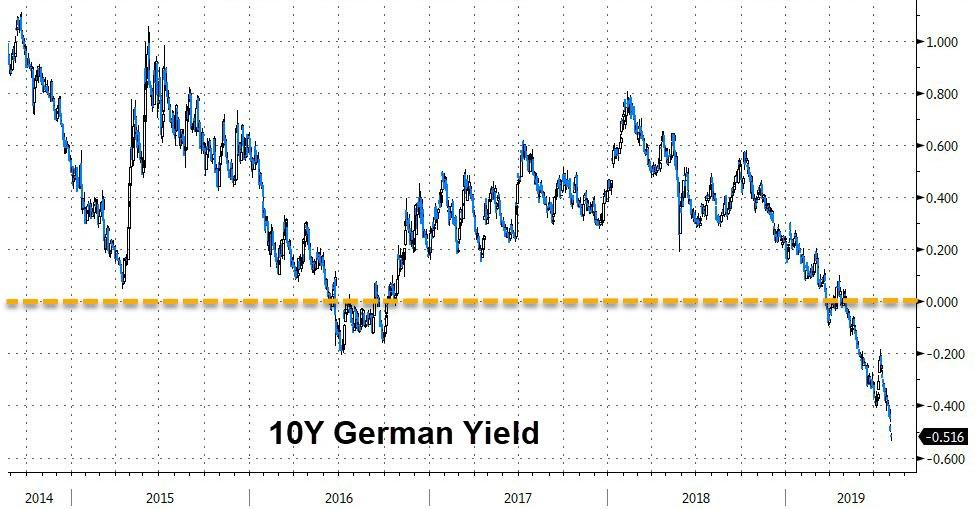
The were no winners with the carnage affecting just about all areas of the globe. European equities were hammered by seeing their biggest 2-day drop in 3 years with the German DAX touching its technically important 200-day M/A. It’s 10-year bond crashed to new lows and now yields a sickening -0.53%.
Domestically, things did not look any better as SmallCaps and Transporations lost their 200-day M/As, while the S&P 500, Dow and Nasdaq dropped below their 100-day M/As.
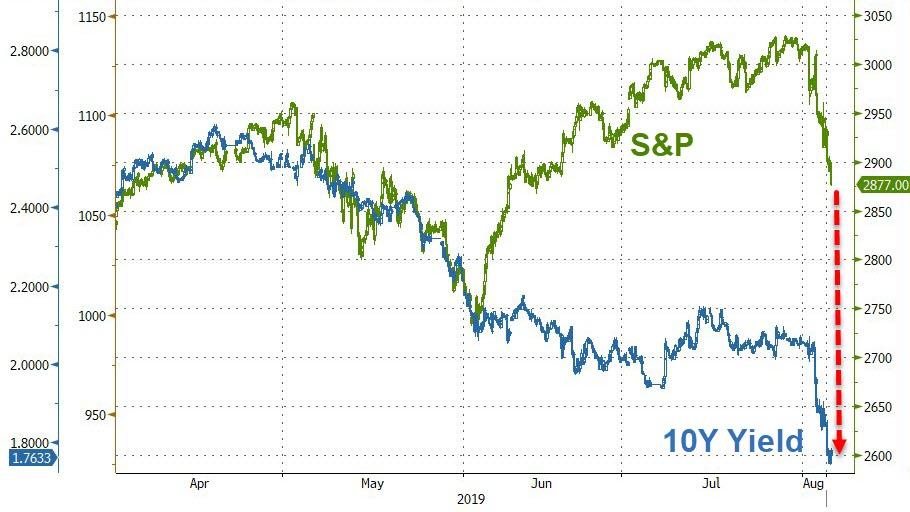
The “jaws of death,” which I have repeatedly posted about, finally shows some closing, but the S&P 500 still has a substantial way to go in order to catch up with the 10-year yield, as this chart demonstrates.
Today’s action weakened our Trend Tracking Indexes (TTIs-section 3 below) considerably, with the International one sinking below its long-term trend line. Usually, a one-day event does not indicate a long-term trend change, so I will give it another couple of days before pulling the trigger and calling that “Buy” cycle to be over.
The Domestic one, remains on the bullish side of its respective trend line but, if there is more downside follow through from today’s bashing, we might end up heading for the safety of the sidelines soon.
Stay tuned.
2. ETFs in the Spotlight
In case you missed the announcement and description of this section, you can read it here again.
It features 10 broadly diversified and sector ETFs from my HighVolume list as posted every Saturday. Furthermore, they are screened for the lowest MaxDD% number meaning they have been showing better resistance to temporary sell offs than all others over the past year.
The below table simply demonstrates the magnitude with which some of the ETFs are fluctuating regarding their positions above or below their respective individual trend lines (%+/-M/A). A break below, represented by a negative number, shows weakness, while a break above, represented by a positive percentage, shows strength.
For hundreds of ETF choices, be sure to reference Thursday’s StatSheet.
For this current domestic “Buy” cycle, here’s how some our candidates have fared:
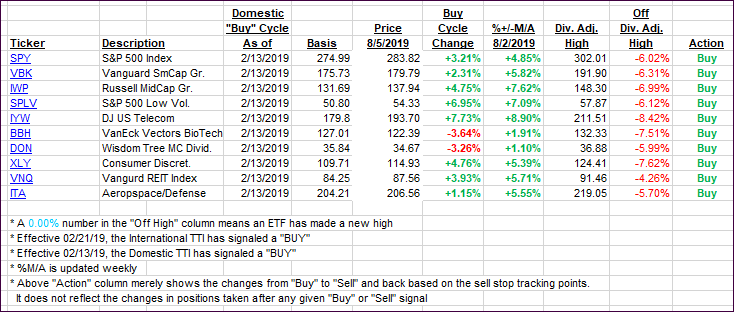
Again, the %+/-M/A column above shows the position of the various ETFs in relation to their respective long-term trend lines, while the trailing sell stops are being tracked in the “Off High” column. The “Action” column will signal a “Sell” once the -8% point has been taken out in the “Off High” column. For more volatile sector ETFs, the trigger point is -10%.
3. Trend Tracking Indexes (TTIs)
Our Trend Tracking Indexes (TTIs) headed sharply south with the International one “losing” its trend line. I will give it a couple of days to see if some stability emerges until declaring this current “Buy” cycle to be over.
Here’s how we closed 08/05/2019:
Domestic TTI: +1.19% above its M/A (last close +4.15%)—Buy signal effective 02/13/2019
International TTI: -1.15% above its M/A (last close +1.25%)—Buy signal effective 06/19/2019
Disclosure: I am obliged to inform you that I, as well as my advisory clients, own some of the ETFs listed in the above table. Furthermore, they do not represent a specific investment recommendation for you, they merely show which ETFs from the universe I track are falling within the specified guidelines.
Contact Ulli