
- Moving the markets
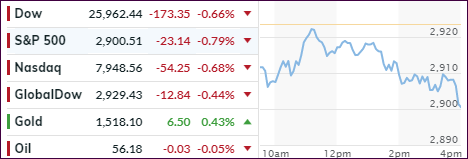
Numerous attempts by the major indexes to break above their respective unchanged lines were rebuffed, as they ended up diving into the close and breaking a 3-day win streak.
Despite Home Depot’s better than expected quarterly results, the markets struggled for altitude all day with worries about the strength of the US economy, along with political developments in Europe (Italy’s prime minister resigned), weighing on government bonds.
The US 10-year yield slipped again by 6 basis points to 1.55%. In the meantime, Trump continued his assault on the Fed by asking to consider deeper cuts, something like 1%. This contradicts the widely advertised view that we have the “best economy ever.” Well, if we did, interest rates would be rising and not declining, as they have been.
After the 3-day rally, uncertainty affected the mood on Wall Street, as Friday’s speech by Fed head Powell looms large, and you can be sure that every word will be dissected when the bankers’ conference in Jackson Hole ends.
For hints of things to come, traders will be busy analyzing the minutes from the Fed’s July policy meeting, which will be released tomorrow. I expect a wait-and-see attitude to keep the indexes in check till Friday.
2. ETFs in the Spotlight
In case you missed the announcement and description of this section, you can read it here again.
It features 10 broadly diversified and sector ETFs from my HighVolume list as posted every Saturday. Furthermore, they are screened for the lowest MaxDD% number meaning they have been showing better resistance to temporary sell offs than all others over the past year.
The below table simply demonstrates the magnitude with which some of the ETFs are fluctuating regarding their positions above or below their respective individual trend lines (%+/-M/A). A break below, represented by a negative number, shows weakness, while a break above, represented by a positive percentage, shows strength.
For hundreds of ETF choices, be sure to reference Thursday’s StatSheet.
For this current domestic “Buy” cycle, here’s how some our candidates have fared:
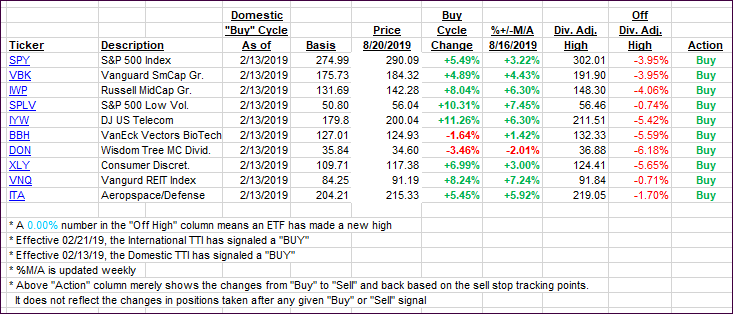
Again, the %+/-M/A column above shows the position of the various ETFs in relation to their respective long-term trend lines, while the trailing sell stops are being tracked in the “Off High” column. The “Action” column will signal a “Sell” once the -8% point has been taken out in the “Off High” column. For more volatile sector ETFs, the trigger point is -10%.
3. Trend Tracking Indexes (TTIs)
Our Trend Tracking Indexes (TTIs) both gave back yesterday’s gains.
Here’s how we closed 08/20/2019:
Domestic TTI: +1.93% above its M/A (prior close +2.76%)—Buy signal effective 02/13/2019
International TTI: -1.34% below its M/A (prior close -0.89%)—Sell signal effective 08/15/2019
Disclosure: I am obliged to inform you that I, as well as my advisory clients, own some of the ETFs listed in the above table. Furthermore, they do not represent a specific investment recommendation for you, they merely show which ETFs from the universe I track are falling within the specified guidelines.
Contact Ulli