
- Moving the markets
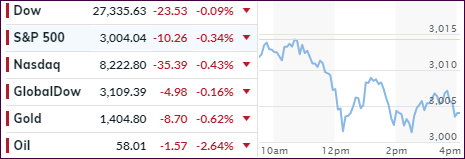
It was a tug-of-war between news stories that kept traders on edge with some headlines causing a sell-off, others creating a recovery, but in the end, the major indexes closed in the red.
We didn’t see the usual last 30-minute rebound due to Trump’s comments that “trade has a long way to go,” as well as bank earnings, which painted a mixed picture of the economy and the financial services arena.
Fed chair Powell chimed in from a speech in France that the “economic outlook hasn’t improved since the last FOMC meeting in June,” which instilled hope that the stage for an interest rate cut later this month appears to be set.
This view was crushed a little bit when June retail sales were released. They exceeded expectations by surging 0.7% MoM, which translates to 4.6% YoY, the most in 12 months. That ended up being a discouragement for the low interest rate crowd. After all, if the consumer, which accounts for 67% of GDP, is spending, why would we need a rate cut?
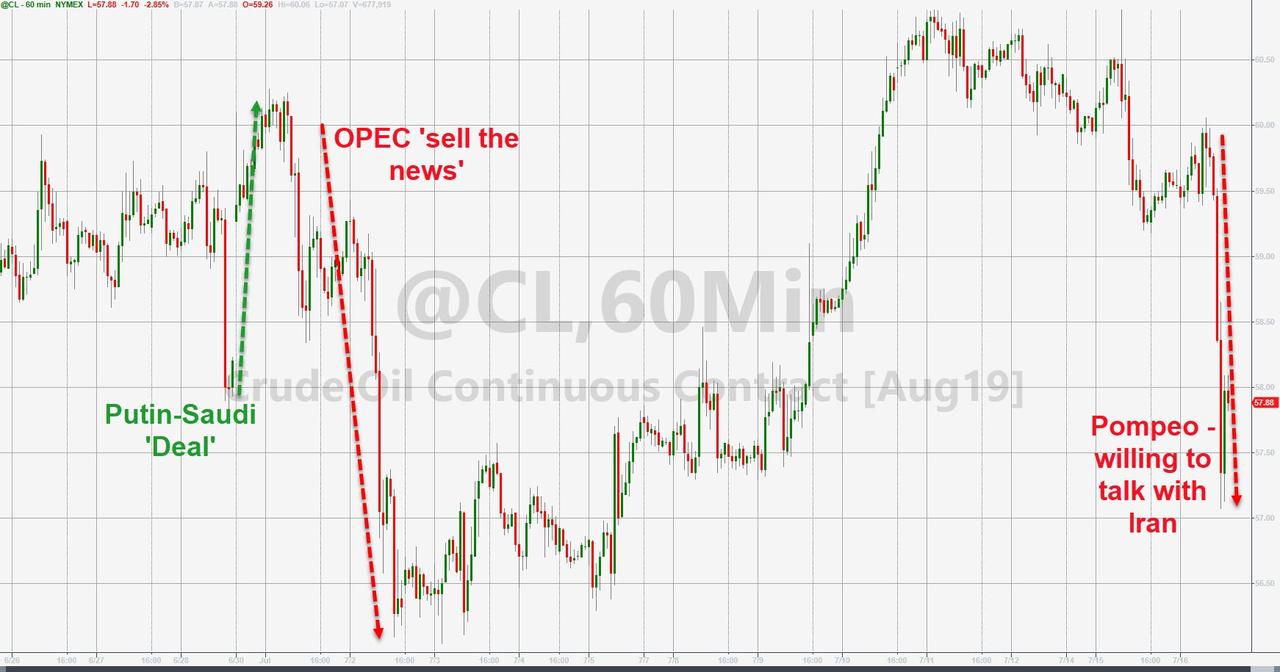
The loser of the day was oil prices, which tanked -2.64% and had a wild ride throughout the session, but in the end the administration’s willingness to “talk to Iran,” took the starch out of the early rally and gave the bears something to cheer about.
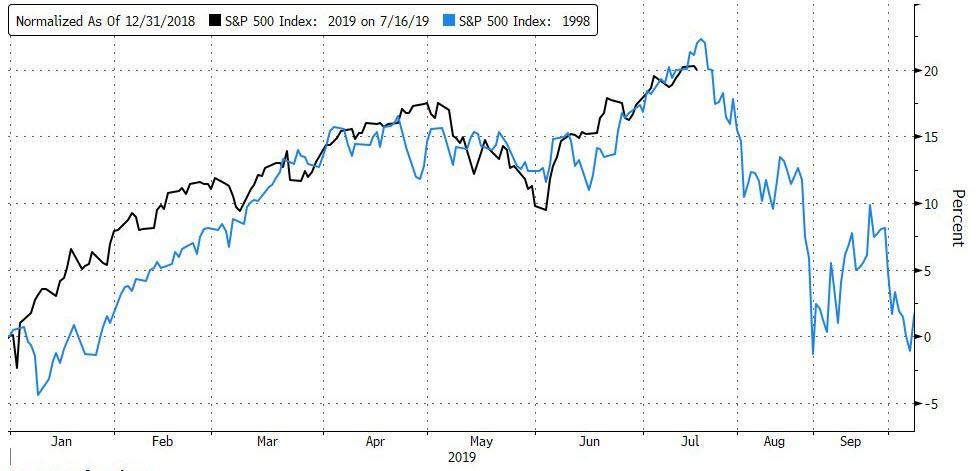
Market behavior today when compared with history may very well be random and totally meaningless. However, it’s interesting to note the similarities when looking at the S&P 500 in 2019 compared to 1998. A tip of the hat goes to ZH for this chart.
2. ETFs in the Spotlight
In case you missed the announcement and description of this section, you can read it here again.
It features 10 broadly diversified and sector ETFs from my HighVolume list as posted every Saturday. Furthermore, they are screened for the lowest MaxDD% number meaning they have been showing better resistance to temporary sell offs than all others over the past year.
The below table simply demonstrates the magnitude with which some of the ETFs are fluctuating regarding their positions above or below their respective individual trend lines (%+/-M/A). A break below, represented by a negative number, shows weakness, while a break above, represented by a positive percentage, shows strength.
For hundreds of ETF choices, be sure to reference Thursday’s StatSheet.
For this current domestic “Buy” cycle, here’s how some our candidates have fared:
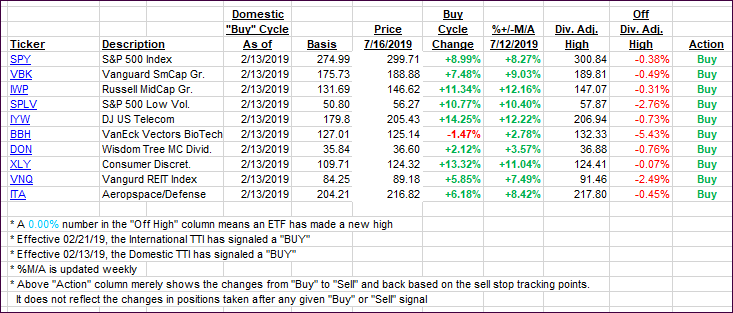
Again, the %+/-M/A column above shows the position of the various ETFs in relation to their respective long-term trend lines, while the trailing sell stops are being tracked in the “Off High” column. The “Action” column will signal a “Sell” once the -8% point has been taken out in the “Off High” column. For more volatile sector ETFs, the trigger point is -10%.
3. Trend Tracking Indexes (TTIs)
Our Trend Tracking Indexes (TTIs) pulled back as the markets were treading water.
Here’s how we closed 07/16/2019:
Domestic TTI: +7.92% above its M/A (last close +8.14%)—Buy signal effective 02/13/2019
International TTI: +5.14% above its M/A (last close +5.32%)—Buy signal effective 06/19/2019
Disclosure: I am obliged to inform you that I, as well as my advisory clients, own some of the ETFs listed in the above table. Furthermore, they do not represent a specific investment recommendation for you, they merely show which ETFs from the universe I track are falling within the specified guidelines.
Contact Ulli