
- Moving the markets
There was not much motivation on the part of the bulls to engage and keep this market from fizzling. The big three, namely lack of progress on the trade dispute with China, mixed earnings results and weak headlines for economic numbers, combined to create a lackluster session.
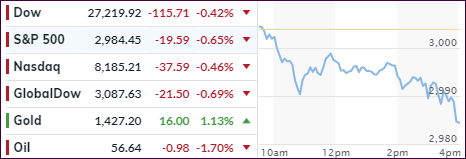
In other words, the recently observed last 30-minute pump was only a distant memory causing the major indexes, who spent most of the day below their unchanged lines, to dive into the close. The losses were moderate, given the recent relentless push into record territory, but it appeared that we simply ran out of steam.
Not helping matters were Building Permits, which plummeted the most in 3 years (-6.1% MoM) putting another nail in the coffin of weak home sales data and mortgage applications, despite ongoing low interest rates. ZH reported that Housing Starts followed suit and dropped -0.9% MoM (vs. -0.7% expected).
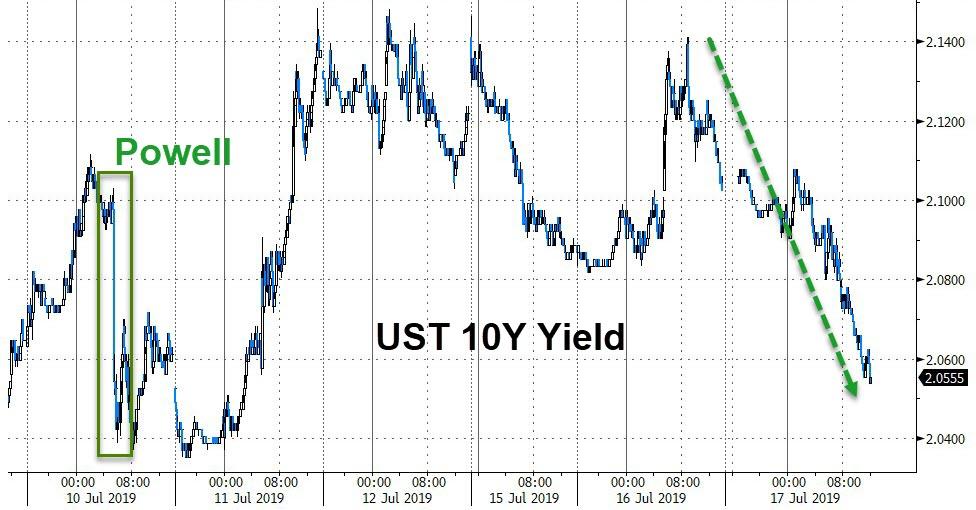
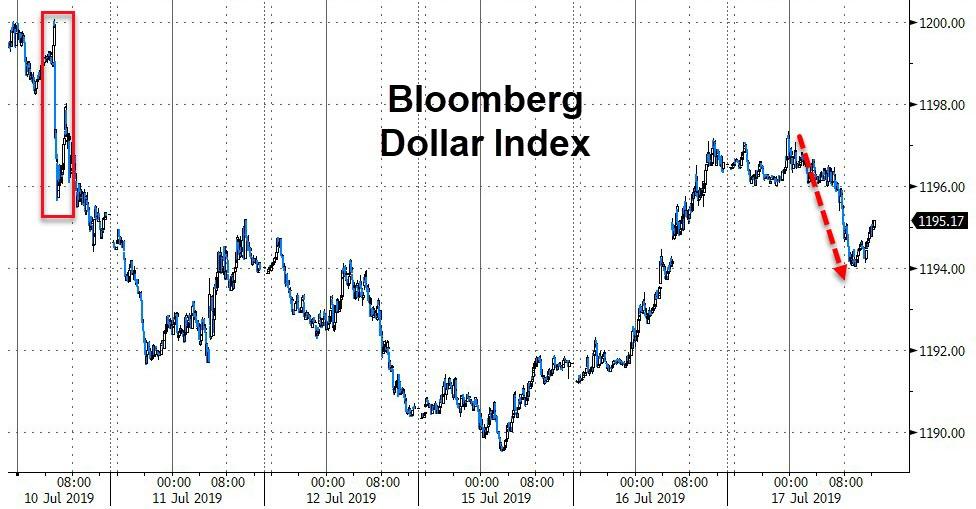
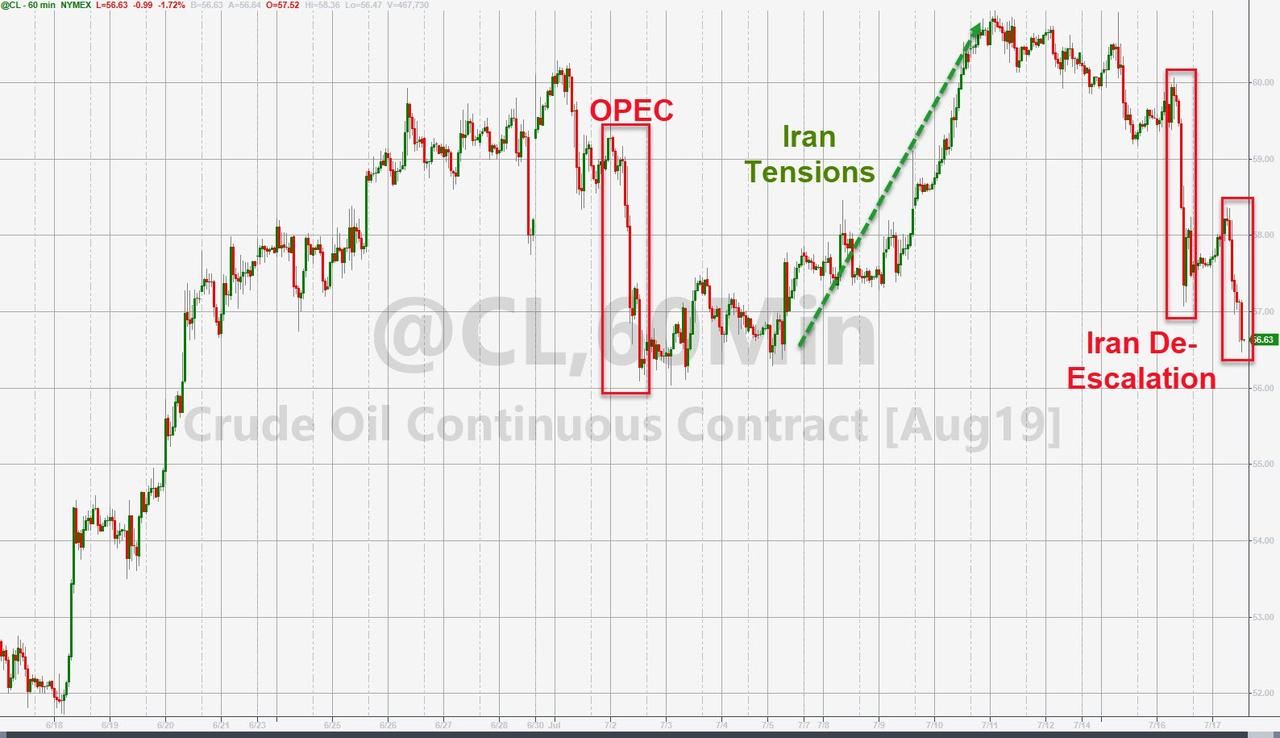
Bond yields headed lower again with the widely held 10-year having almost made up the losses sustained in the last week, when we hovered around the 2.14% marker, which is quite a drop to today’s 2.06%. At the same time, the US Dollar pulled back, while Oil continued its downward spiral after a de-escalation of tensions with Iran.
Only about 7% of the S&P 500 companies have reported earnings so far, so we certainly will have more surprises on deck, any of which can push the markets in either direction.
2. ETFs in the Spotlight
In case you missed the announcement and description of this section, you can read it here again.
It features 10 broadly diversified and sector ETFs from my HighVolume list as posted every Saturday. Furthermore, they are screened for the lowest MaxDD% number meaning they have been showing better resistance to temporary sell offs than all others over the past year.
The below table simply demonstrates the magnitude with which some of the ETFs are fluctuating regarding their positions above or below their respective individual trend lines (%+/-M/A). A break below, represented by a negative number, shows weakness, while a break above, represented by a positive percentage, shows strength.
For hundreds of ETF choices, be sure to reference Thursday’s StatSheet.
For this current domestic “Buy” cycle, here’s how some our candidates have fared:
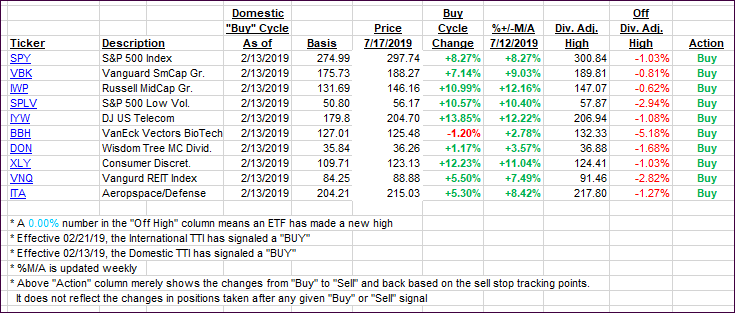
Again, the %+/-M/A column above shows the position of the various ETFs in relation to their respective long-term trend lines, while the trailing sell stops are being tracked in the “Off High” column. The “Action” column will signal a “Sell” once the -8% point has been taken out in the “Off High” column. For more volatile sector ETFs, the trigger point is -10%.
3. Trend Tracking Indexes (TTIs)
Our Trend Tracking Indexes (TTIs) headed south as bullish sentiment was conspicuously absent.
Here’s how we closed 07/17/2019:
Domestic TTI: +7.02% above its M/A (last close +7.92%)—Buy signal effective 02/13/2019
International TTI: +4.41% above its M/A (last close +5.14%)—Buy signal effective 06/19/2019
Disclosure: I am obliged to inform you that I, as well as my advisory clients, own some of the ETFs listed in the above table. Furthermore, they do not represent a specific investment recommendation for you, they merely show which ETFs from the universe I track are falling within the specified guidelines.
Contact Ulli