
- Moving the markets
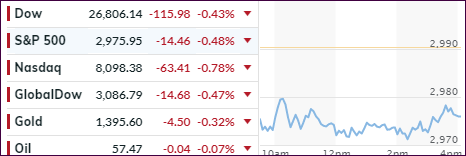
All session long, the major indexes were stuck below their respective unchanged lines, as uncertainty about the much anticipated and expected rated cut by the Fed later this month kept equities in check.
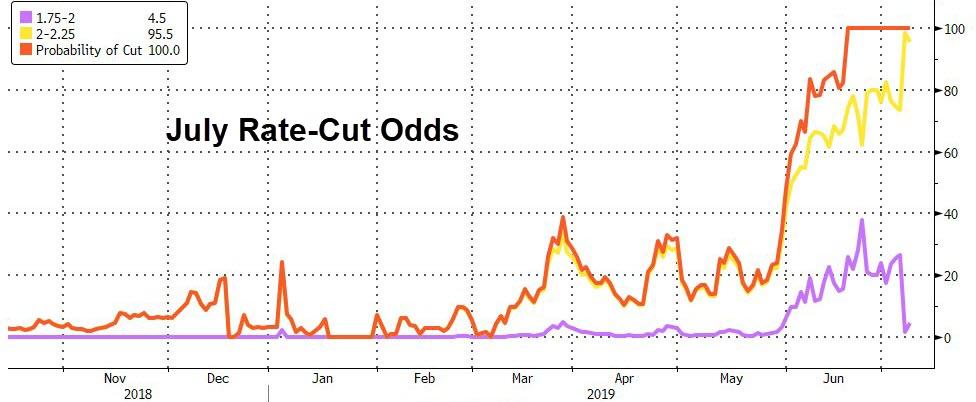
After all, we are only a few steps away from all-time highs, traders believe we are in a strong economic environment, despite evidence to the contrary, and want a rate cut so that stocks can continue to rise ad infinitum. The July rate-cut odds remain at 100%, as this chart shows.
Besides rate cut hopes being questioned, all eyes are on Fed chair Powell on Wednesday when he testifies before Congress on the state of the US economy as well as monetary policy. He will then also speak before the Senate on Thursday, but most likely his speech will be a repeat. Nevertheless, every one of his words will be dissected to analyze what he really meant to say.
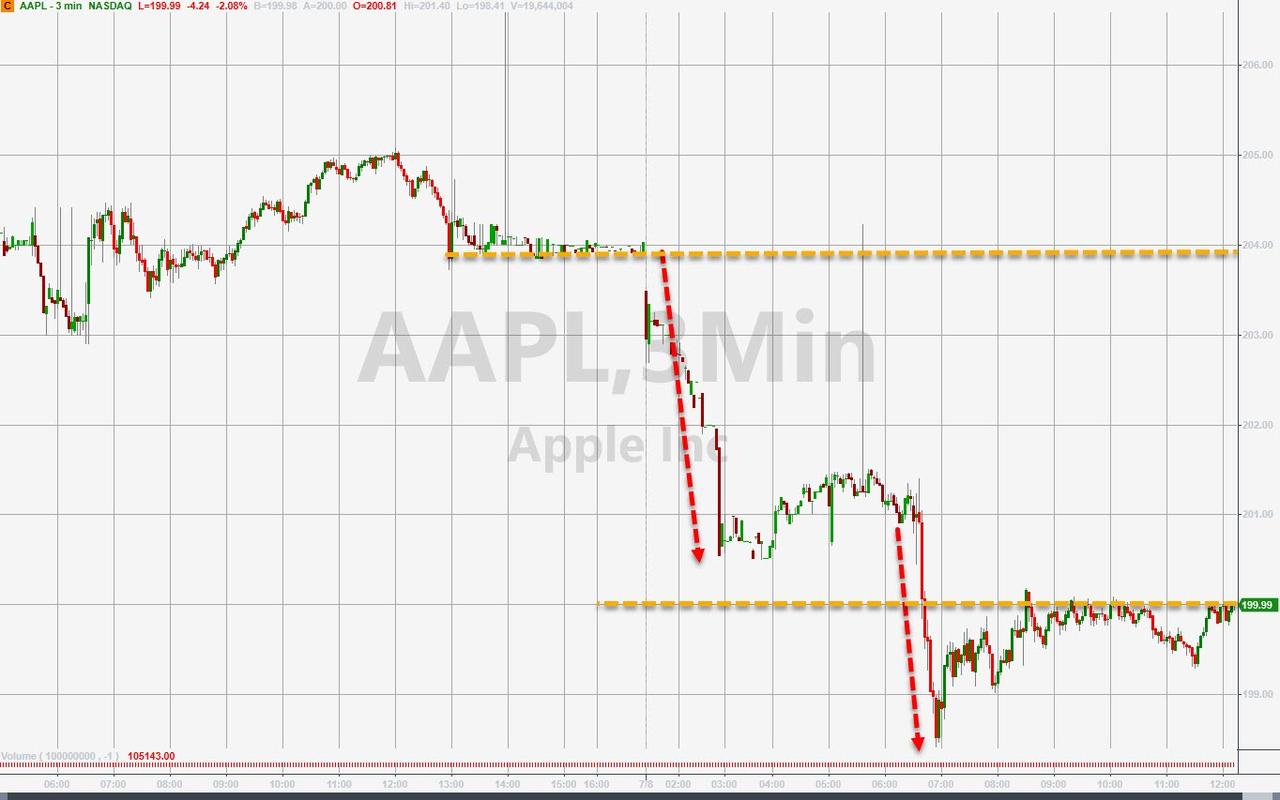
In the stock arena, Boeing proved to be a drag on the Dow, due to the Saudis cancelling a $5.5 billion order, while Apple suffered as well, after an analyst downgraded the company from ‘neutral’ to ‘sell.’ Ouch!
With all the hype surrounding the rate-cut scenario, I wonder what will happen to equities if the Fed disappoints and does nothing? Consider, there is no Fed meeting in August, so the wait till September could give the bears a reason to do some serious chest pounding.
2. ETFs in the Spotlight
In case you missed the announcement and description of this section, you can read it here again.
It features 10 broadly diversified and sector ETFs from my HighVolume list as posted every Saturday. Furthermore, they are screened for the lowest MaxDD% number meaning they have been showing better resistance to temporary sell offs than all others over the past year.
The below table simply demonstrates the magnitude with which some of the ETFs are fluctuating regarding their positions above or below their respective individual trend lines (%+/-M/A). A break below, represented by a negative number, shows weakness, while a break above, represented by a positive percentage, shows strength.
For hundreds of ETF choices, be sure to reference Thursday’s StatSheet.
For this current domestic “Buy” cycle, here’s how some our candidates have fared:
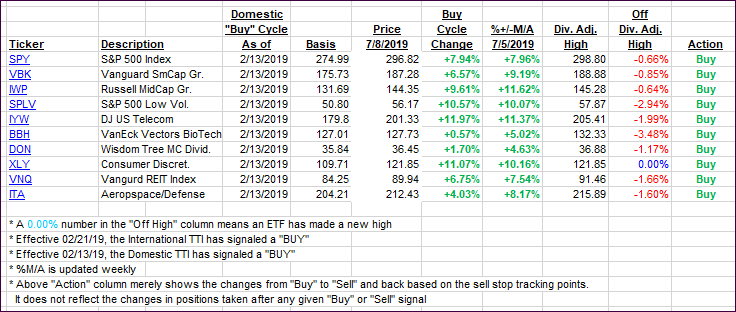
Again, the %+/-M/A column above shows the position of the various ETFs in relation to their respective long-term trend lines, while the trailing sell stops are being tracked in the “Off High” column. The “Action” column will signal a “Sell” once the -8% point has been taken out in the “Off High” column. For more volatile sector ETFs, the trigger point is -10%.
3. Trend Tracking Indexes (TTIs)
Our Trend Tracking Indexes (TTIs) pulled back, as upward momentum was non-existent.
Here’s how we closed 07/08/2019:
Domestic TTI: +7.48% above its M/A (last close +8.08%)—Buy signal effective 02/13/2019
International TTI: +4.52% above its M/A (last close +5.03%)—Buy signal effective 06/19/2019
Disclosure: I am obliged to inform you that I, as well as my advisory clients, own some of the ETFs listed in the above table. Furthermore, they do not represent a specific investment recommendation for you, they merely show which ETFs from the universe I track are falling within the specified guidelines.
Contact Ulli