
- Moving the markets
Throughout today’s session, equities were under pressure due to the looming earning season. Traders were a bit anxious to find out if some of the poor economic data points of the last quarter, or the U.S.-China trade war, are having an impact on companies’ bottom lines.
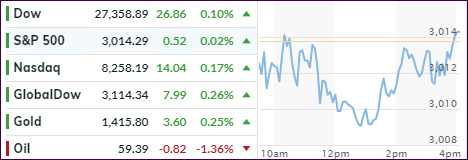
The major indexes spent most of the day below their respective
unchanged lines, although by only a tiny margin, but managed to close in the green
thanks to the usual last 30-minute pump.
China posted its weakest economic growth in 27 years by growing only 6.2%. One analyst did not see this as a cause for concern, since “a further round of monetary-policy stimulus has helped to soften the impact of a relatively weak GDP print.”
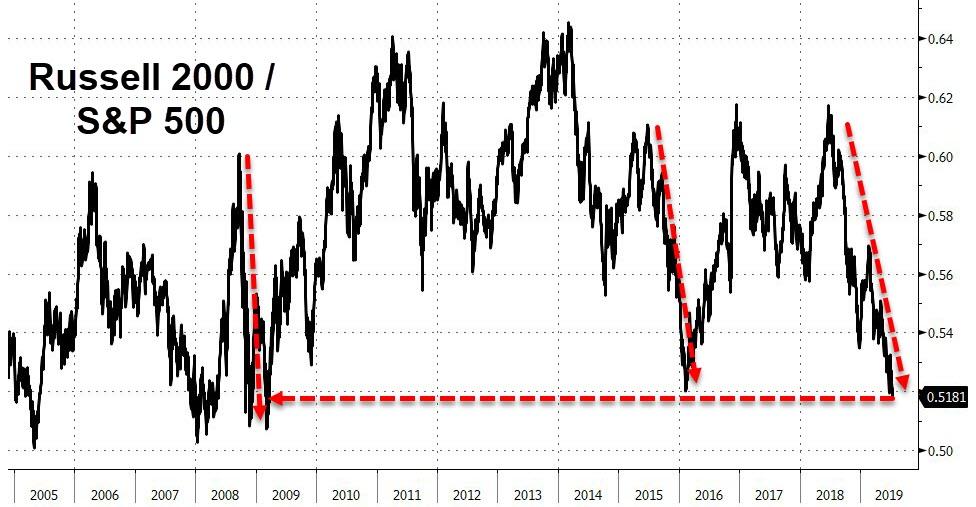
On the domestic side, it’s interesting to note that SmallCaps are continuing to collapse relative to LargeCaps, which this long-term chart makes abundantly clear.
This is somewhat strange when considering the negative effects of the U.S.-China trade war should weigh far more on large-cap multinational companies rather than on more domestically oriented small-cap companies.
Be that as it may, right now, the focus is on earnings season, and it will be interesting to see what directional market effect it might have.
2. ETFs in the Spotlight
In case you missed the announcement and description of this section, you can read it here again.
It features 10 broadly diversified and sector ETFs from my HighVolume list as posted every Saturday. Furthermore, they are screened for the lowest MaxDD% number meaning they have been showing better resistance to temporary sell offs than all others over the past year.
The below table simply demonstrates the magnitude with which some of the ETFs are fluctuating regarding their positions above or below their respective individual trend lines (%+/-M/A). A break below, represented by a negative number, shows weakness, while a break above, represented by a positive percentage, shows strength.
For hundreds of ETF choices, be sure to reference Thursday’s StatSheet.
For this current domestic “Buy” cycle, here’s how some our candidates have fared:
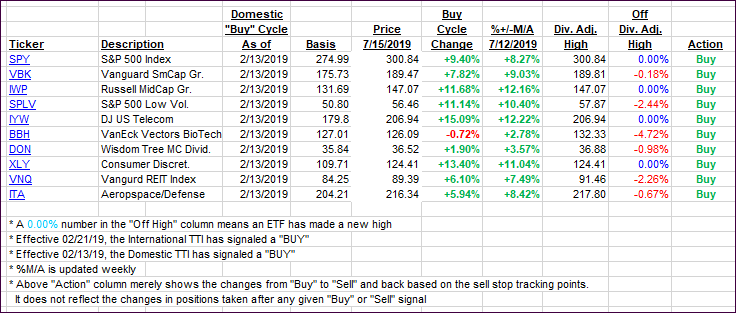
Again, the %+/-M/A column above shows the position of the various ETFs in relation to their respective long-term trend lines, while the trailing sell stops are being tracked in the “Off High” column. The “Action” column will signal a “Sell” once the -8% point has been taken out in the “Off High” column. For more volatile sector ETFs, the trigger point is -10%.
3. Trend Tracking Indexes (TTIs)
Our Trend Tracking Indexes (TTIs) were mixed with the International one showing better upward momentum—at least for today.
Here’s how we closed 07/15/2019:
Domestic TTI: +8.14% above its M/A (last close +8.22%)—Buy signal effective 02/13/2019
International TTI: +5.32% above its M/A (last close +5.12%)—Buy signal effective 06/19/2019
Disclosure: I am obliged to inform you that I, as well as my advisory clients, own some of the ETFs listed in the above table. Furthermore, they do not represent a specific investment recommendation for you, they merely show which ETFs from the universe I track are falling within the specified guidelines.
Contact Ulli