
- Moving the markets
Yesterday, the markets closed on a sour note by scoring their lows for session in the final seconds of trading. That usually does not bode well for the next day’s opening, and today was no exception.
The major indexes slipped early on but managed to rebound by mid-day with fresh upward momentum pushing equities into the green, caused by the Fed’s Williams opining that:
“interest rates should be cut as insurance against an economic downturn,”
And
“when you have only so much stimulus at your disposal, it pays to act quickly to lower rates at the first sign of economic distress.”
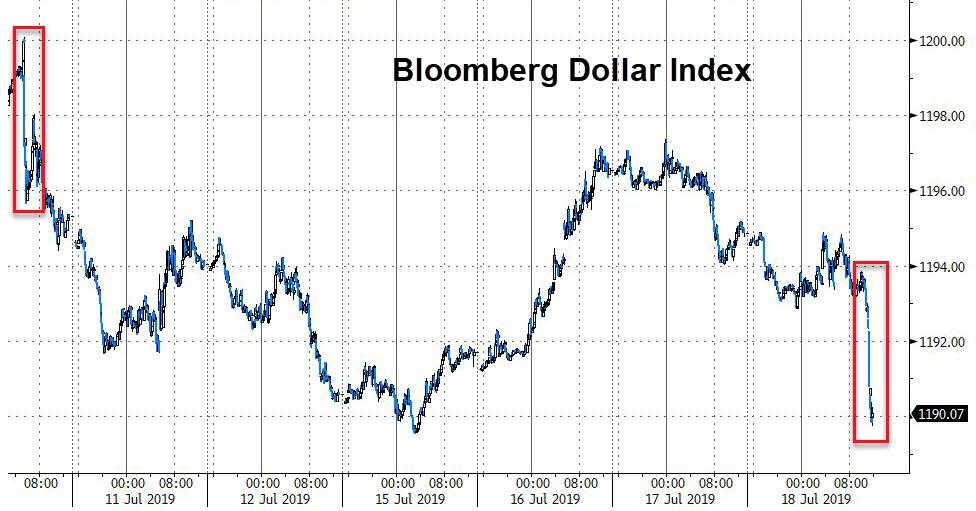
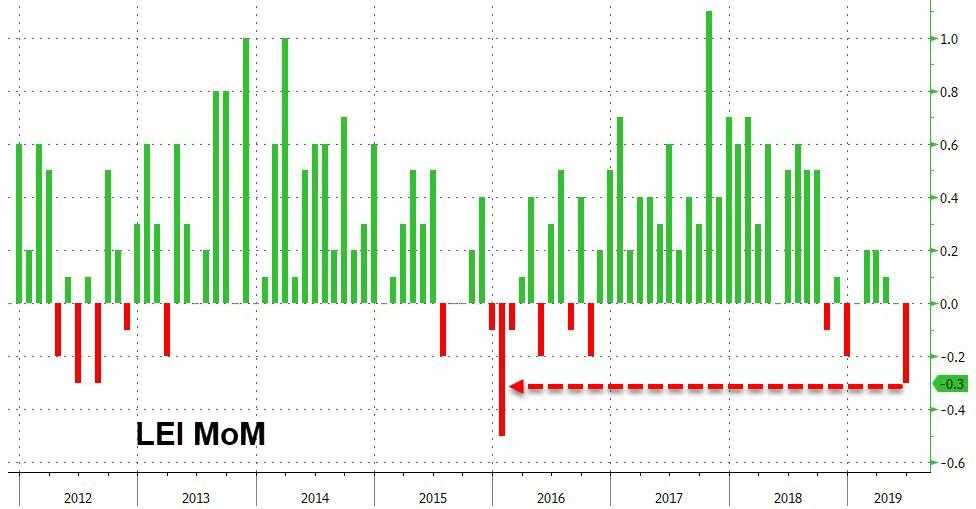
That pretty much saved the day for stocks but took the starch out of the US dollar, as the latest Leading Indicators headline did not help matters. They slumped the most in over 40 months by tumbling -0.3% in June, which was their biggest MoM drop since early 2016.
Then the WSJ reported that trade-deal negotiations between the U.S. and China had hit a snag (what else is new?) raising doubts about whether the warring parties can ever reconcile their differences.
On the earnings front, things were mixed at best with Netflix being the loser of the day by surrendering almost -11%. This was due to a bad miss on expectations for new paying subscribers.
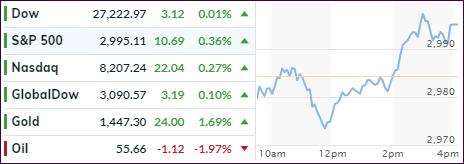
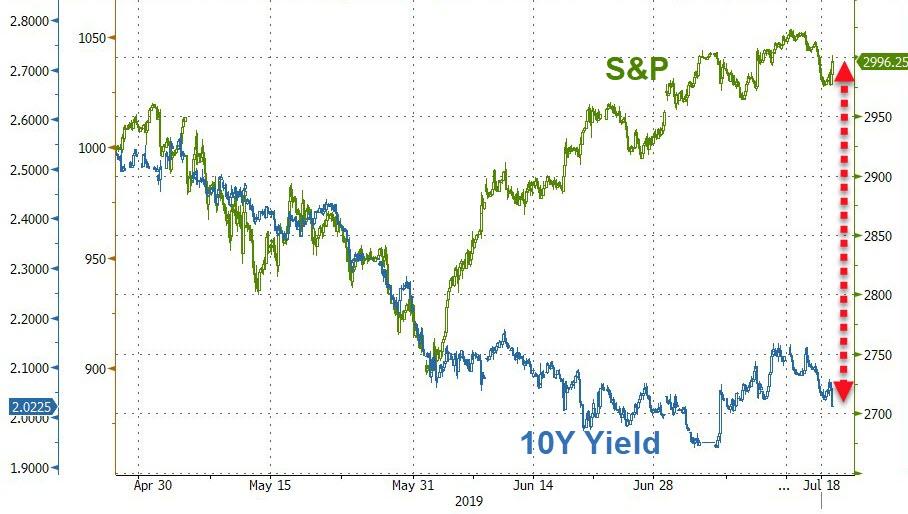
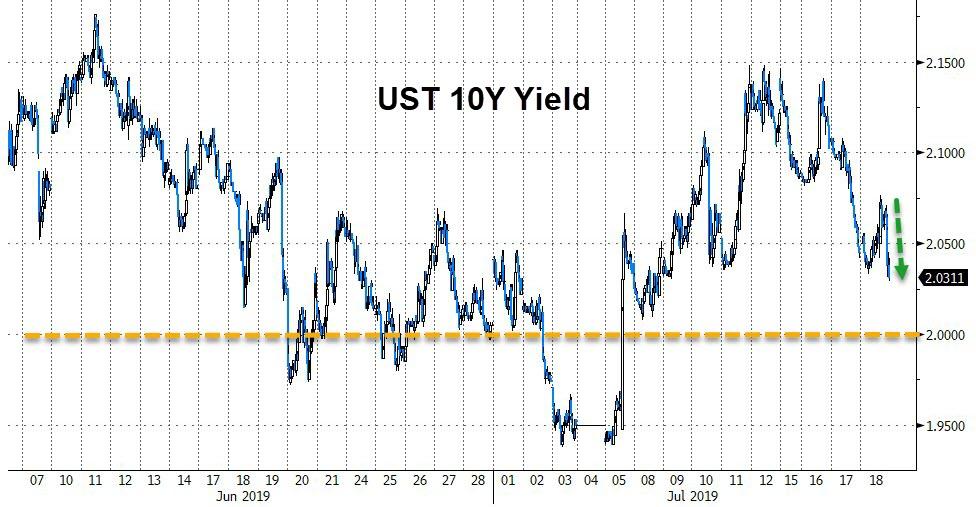
In the end, the S&P 500 failed to reclaim its recently lost 3k marker, while the Dow barely held on to a green close. The decoupling between the S&P 500 and the 10-year yield continues uncompromisingly, the latter of which has been now trending back towards the 2% level.
2. ETFs in the Spotlight
In case you missed the announcement and description of this section, you can read it here again.
It features 10 broadly diversified and sector ETFs from my HighVolume list as posted every Saturday. Furthermore, they are screened for the lowest MaxDD% number meaning they have been showing better resistance to temporary sell offs than all others over the past year.
The below table simply demonstrates the magnitude with which some of the ETFs are fluctuating regarding their positions above or below their respective individual trend lines (%+/-M/A). A break below, represented by a negative number, shows weakness, while a break above, represented by a positive percentage, shows strength.
For hundreds of ETF choices, be sure to reference Thursday’s StatSheet.
For this current domestic “Buy” cycle, here’s how some our candidates have fared:
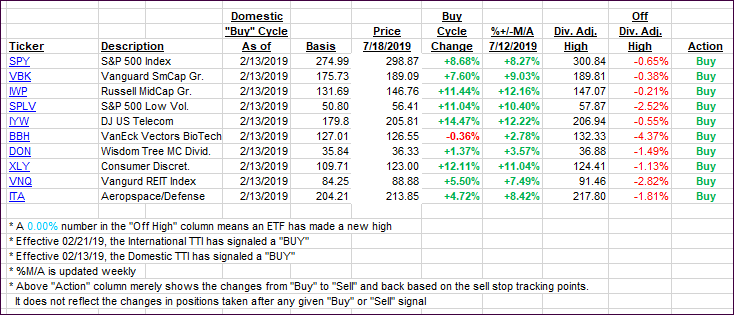
Again, the %+/-M/A column above shows the position of the various ETFs in relation to their respective long-term trend lines, while the trailing sell stops are being tracked in the “Off High” column. The “Action” column will signal a “Sell” once the -8% point has been taken out in the “Off High” column. For more volatile sector ETFs, the trigger point is -10%.
3. Trend Tracking Indexes (TTIs)
Our Trend Tracking Indexes (TTIs) recovered, as a late-day rally wiped out early losses.
Here’s how we closed 07/18/2019:
Domestic TTI: +7.44% above its M/A (last close +7.02%)—Buy signal effective 02/13/2019
International TTI: +4.52% above its M/A (last close +4.41%)—Buy signal effective 06/19/2019
Disclosure: I am obliged to inform you that I, as well as my advisory clients, own some of the ETFs listed in the above table. Furthermore, they do not represent a specific investment recommendation for you, they merely show which ETFs from the universe I track are falling within the specified guidelines.
Contact Ulli