
1. Moving the markets
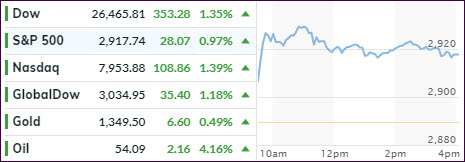
Trump got the markets pumping this morning after tweeting that there will be an “extended meeting” with China’s Xi at the upcoming G-20 meeting in Japan. Bloomberg also added that the two leaders had confirmed a plan for meeting on the sidelines.
That was enough hype for the headline-scanning computer algos to drive the markets out of last week’s trading range, with the S&P 500 now hovering within 1.25% of its record high. Never mind that various reports later-on toned down the Trump/Xi meeting, but that no longer mattered. The bulls were up and running.
The other positive for equities was what appeared to be a policy turnaround, when the head of the European Central Bank (ECB), Draghi, hinted at lower rates and more stimulus. I recall that, only a few weeks ago, Draghi announced no policy changes in the foreseeable future. Hmm, things must have really taken a turn for the worse…
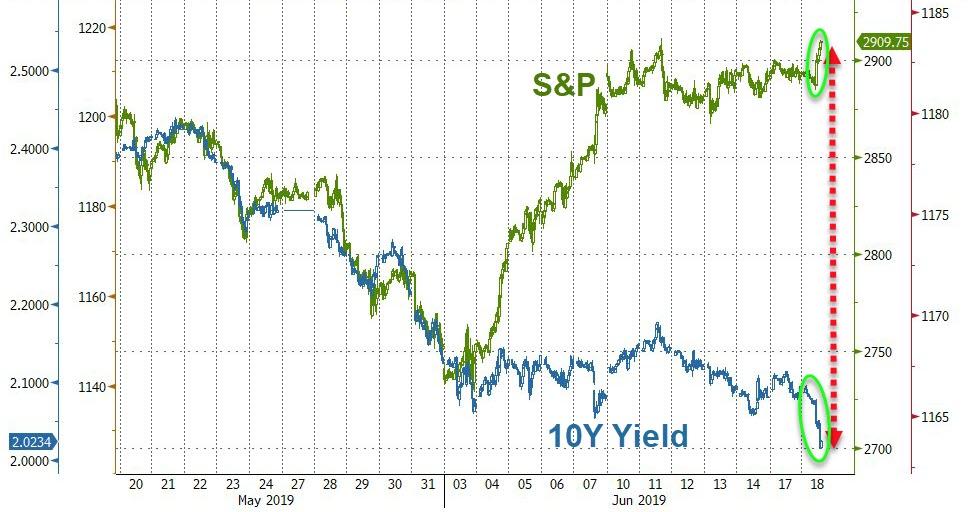
His dovishness was just what global traders wanted to hear with the instant result that stocks pumped and yields dumped, widening the already substantial divergence between the S&P 500 and the 10-year yield.
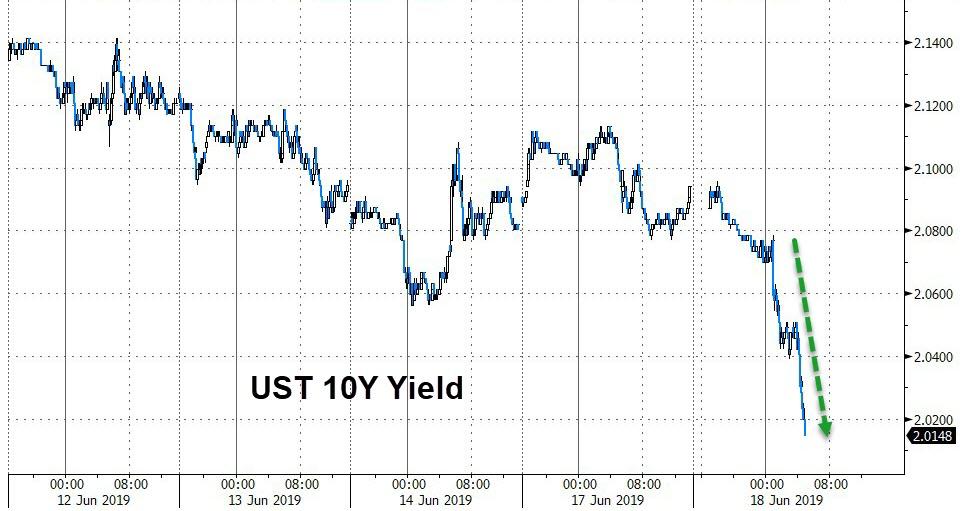
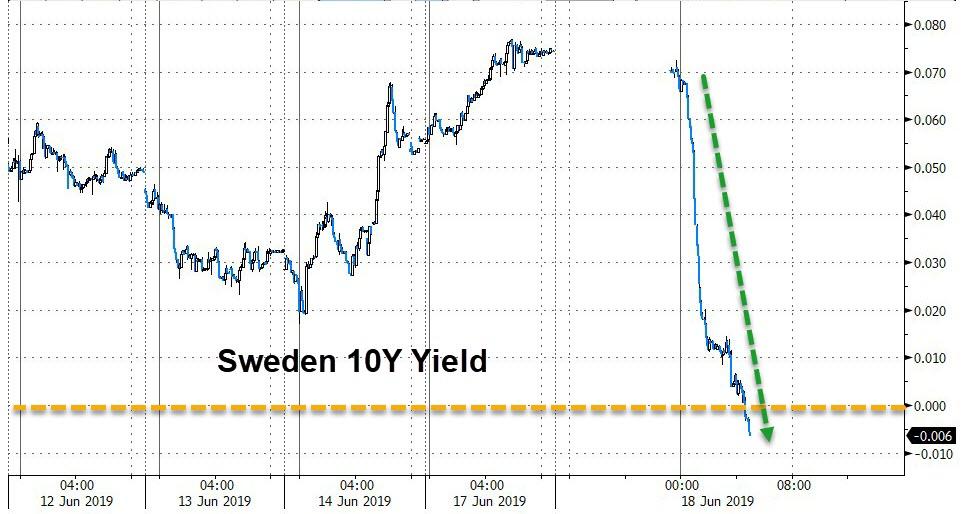
Bond yields crashed globally, as you can see here, here and here. Other than the U.S., most bond yields on the face of this earth have now slipped into negative territory. For example, if you invest in a German 10-year bond (called ‘Bund’), your annual interest rate is now -0.32%. In other words, you lose -0.32% every year for 10 years. How is that for insanity?
For further contemplation, ZH posted the question: Who’s right? Global Bonds, Global Stocks or Global Macro? This chart shows the divergence. Eventually, we will find out the answer to that question.
My guess is that bonds will prove to be right, with stocks ultimately having to correct down to fair value.
2. ETFs in the Spotlight
In case you missed the announcement and description of this section, you can read it here again.
It features 10 broadly diversified and sector ETFs from my HighVolume list as posted every Saturday. Furthermore, they are screened for the lowest MaxDD% number meaning they have been showing better resistance to temporary sell offs than all others over the past year.
The below table simply demonstrates the magnitude with which some of the ETFs are fluctuating regarding their positions above or below their respective individual trend lines (%+/-M/A). A break below, represented by a negative number, shows weakness, while a break above, represented by a positive percentage, shows strength.
For hundreds of ETF choices, be sure to reference Thursday’s StatSheet.
For this current domestic “Buy” cycle, here’s how some our candidates have fared:
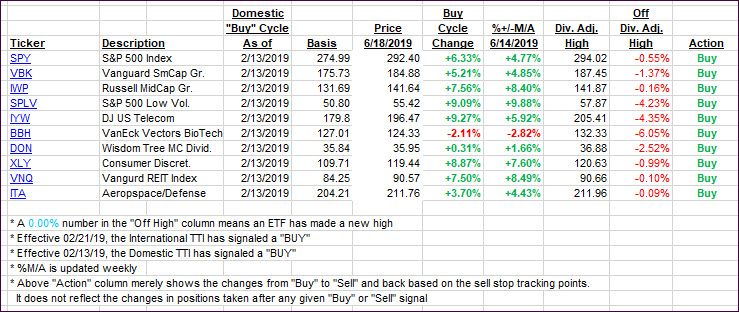
Again, the %+/-M/A column above shows the position of the various ETFs in relation to their respective long-term trend lines, while the trailing sell stops are being tracked in the “Off High” column. The “Action” column will signal a “Sell” once the -8% point has been taken out in the “Off High” column. For more volatile sector ETFs, the trigger point is -10%.
3. Trend Tracking Indexes (TTIs)
Our Trend Tracking Indexes (TTIs) got pushed higher with the International one now having solidified its place above its trend line. As a result, a new ‘Buy’ cycle has been generated for “broadly diversified international ETFs/mutual funds.”
The effective date will be tomorrow, 6/19/19, unless markets are staging a sharp pullback. In that case, I will hold off for another day. Please note that in my advisory practice, we will not be participating in this ‘Buy’ cycle at this time, since we have fully invested portfolios.
Here’s how we closed 06/18/2019:
Domestic TTI: +5.42% above its M/A (last close +4.39%)—Buy signal effective 02/13/2019
International TTI: +2.66% above its M/A (last close +1.47%)—Buy signal effective 06/19/2019
Disclosure: I am obliged to inform you that I, as well as my advisory clients, own some of the ETFs listed in the above table. Furthermore, they do not represent a specific investment recommendation for you, they merely show which ETFs from the universe I track are falling within the specified guidelines.
Contact Ulli