
- Moving the markets
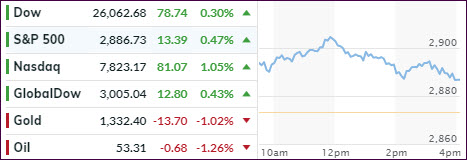
A quick end to the Mexican tariff saga helped the major indexes to follow through from Friday’s rally with the Nasdaq taking the lead, while the Dow ended higher for the 6th straight session. Upward momentum, however, hit a glass ceiling mid-day, and we faded into the close.
However, not all is peaches and cream, and Trump warned that should Mexico’s cooperation to stem the flow of illegal immigrants fail, “we can always go back to our previous, very profitable, position on tariffs.”
Giving the market an assist as well was the fact that the Fed is on deck next week, and we will find out if lower interest rates, which already have been priced in, will come to fruition. Traders anticipate that last week’s poor jobs report will influence the Fed’s decision in favor of a reduction in rates.
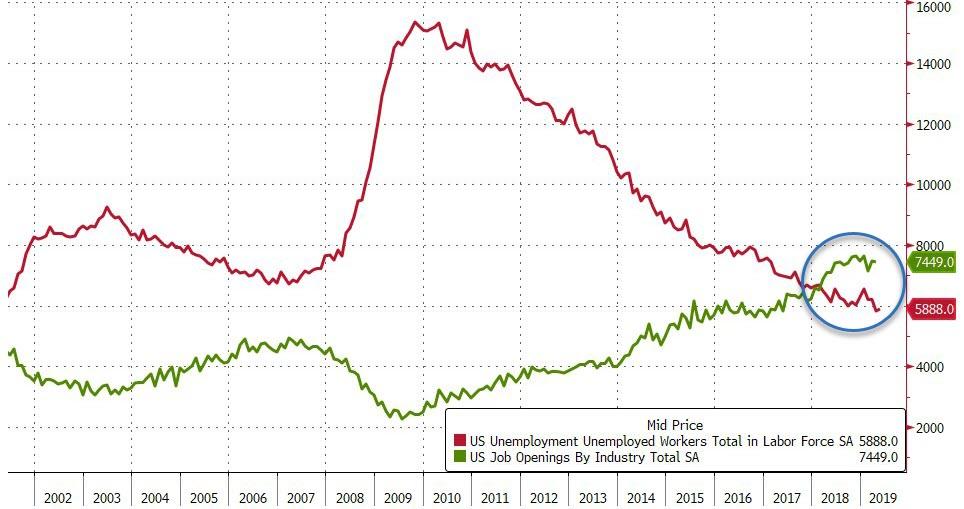
On the economic side, things did not look rosy, as job openings fell in April, while layoffs picked up at the same time. However, job openings remain above the number of unempoyed workers for the 14th month in a row.
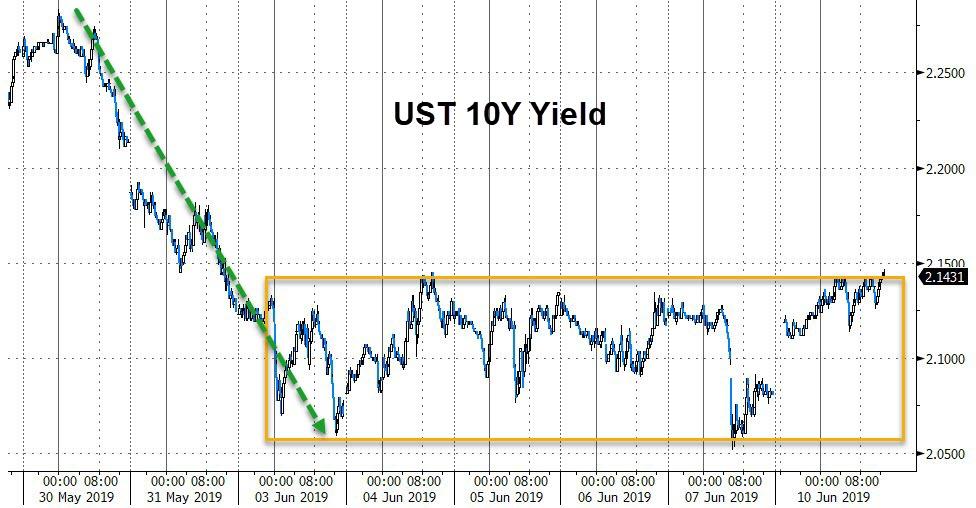
Bond yields rose notably on the day, which affected the low volatily ETF (SPLV) negatively, but its unrealized gain for this Domestic Buy cycle remains higher than that of its SPY cousin (section 2) by over 50%.
Our International TTI edged deeper into bullish territory, but it has been hovering above the line for only 3 days. This move could reverse in a hurry, so I will look for more confirmation before declaring a new ‘Buy’ for this sector.
Continue reading…
2. ETFs in the Spotlight
In case you missed the announcement and description of this section, you can read it here again.
It features 10 broadly diversified and sector ETFs from my HighVolume list as posted every Saturday. Furthermore, they are screened for the lowest MaxDD% number meaning they have been showing better resistance to temporary sell offs than all others over the past year.
The below table simply demonstrates the magnitude with which some of the ETFs are fluctuating regarding their positions above or below their respective individual trend lines (%+/-M/A). A break below, represented by a negative number, shows weakness, while a break above, represented by a positive percentage, shows strength.
For hundreds of ETF choices, be sure to reference Thursday’s StatSheet.
For this current domestic “Buy” cycle, here’s how some our candidates have fared:
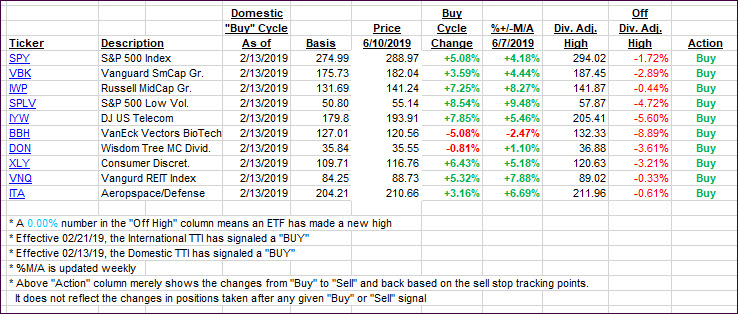
Again, the %+/-M/A column above shows the position of the various ETFs in relation to their respective long-term trend lines, while the trailing sell stops are being tracked in the “Off High” column. The “Action” column will signal a “Sell” once the -8% point has been taken out in the “Off High” column. For more volatile sector ETFs, the trigger point is -10%.
3. Trend Tracking Indexes (TTIs)
Our Trend Tracking Indexes (TTIs) headed north with the International one now being on the positive side of its trend line for the third day. I’d like to see a little more staying power before declaring this ‘Sell’ signal to be over.
Here’s how we closed 06/10/2019:
Domestic TTI: +4.47% above its M/A (last close +4.14%)—Buy signal effective 02/13/2019
International TTI: +1.58% above its M/A (last close +1.11%)—Sell signal effective 05/30/2019
Disclosure: I am obliged to inform you that I, as well as my advisory clients, own some of the ETFs listed in the above table. Furthermore, they do not represent a specific investment recommendation for you, they merely show which ETFs from the universe I track are falling within the specified guidelines.
Contact Ulli