
- Moving the markets
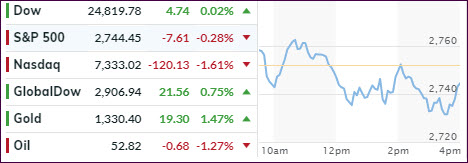
Tech stocks took a tumble and dragged the overall market down with some damage control setting in during the last 30 minutes of the session.
Global tariff fears, along with reports that the Trump administration has launched a multi-pronged anti-trust battle against big tech due to possible anti-trust violations, created enough uncertainty to keep any bullish momentum in check.
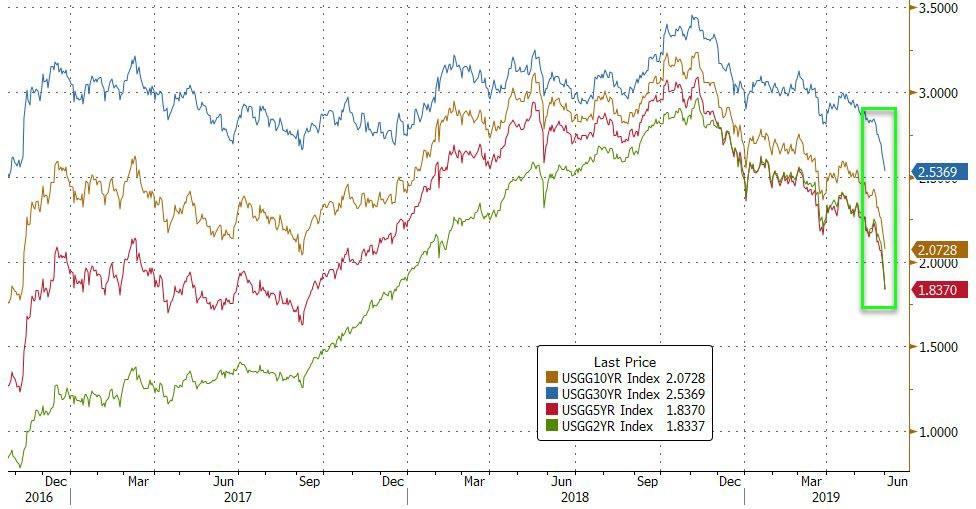
Additionally, bond yields continued to plunge with the 10-year deepening its inversion against the 3-month T-Bill, a scenario that has accurately predicted economic recessions in the past.
Not helping matters were increased worries regarding the intensification of the U.S. trade frictions with China and Mexico, to which India has been added, while rumor has it that Australia may be on deck.
Domestically, the manufacturing soft survey data tumbled last month with the headline PMI falling to its lowest level since September 2009, as output growth eased considerably, which is not exactly awe inspiring, as this chart shows.
Besides the carnage in tech, the losses were modest with our Domestic TTI improving, which means a potentail ‘Sell’ signal has been averted for the time being.
2. ETFs in the Spotlight
In case you missed the announcement and description of this section, you can read it here again.
It features 10 broadly diversified and sector ETFs from my HighVolume list as posted every Saturday. Furthermore, they are screened for the lowest MaxDD% number meaning they have been showing better resistance to temporary sell offs than all others over the past year.
The below table simply demonstrates the magnitude with which some of the ETFs are fluctuating regarding their positions above or below their respective individual trend lines (%+/-M/A). A break below, represented by a negative number, shows weakness, while a break above, represented by a positive percentage, shows strength.
For hundreds of ETF choices, be sure to reference Thursday’s StatSheet.
For this current domestic “Buy” cycle, here’s how some our candidates have fared:

Again, the %+/-M/A column above shows the position of the various ETFs in relation to their respective long-term trend lines, while the trailing sell stops are being tracked in the “Off High” column. The “Action” column will signal a “Sell” once the -8% point has been taken out in the “Off High” column. For more volatile sector ETFs, the trigger point is -10%.
3. Trend Tracking Indexes (TTIs)
Our Trend Tracking Indexes (TTIs) improved with the Domestic one hovering around its trend line.
Here’s how we closed 06/03/2019:
Domestic TTI: -0.07% Below its M/A (last close -0.64%)—Buy signal effective 02/13/2019
International TTI: -1.76% below its M/A (last close -2.40%)—Sell signal effective 05/30/2019
Disclosure: I am obliged to inform you that I, as well as my advisory clients, own some of the ETFs listed in the above table. Furthermore, they do not represent a specific investment recommendation for you, they merely show which ETFs from the universe I track are falling within the specified guidelines.
Contact Ulli