
1. Moving the markets
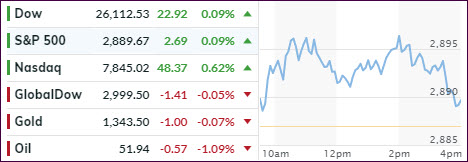
An early rally ran out of steam, but the major indexes managed to eke out a small gain thanks to a positive spin on social media and entertainment stocks.
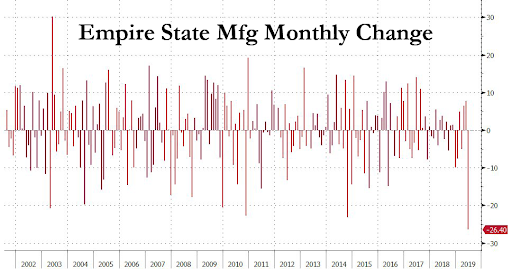
Economic news was not awe inspiring, as the NY manufacturing survey crashed the most on record, from +17.8 to -8.6 in June, which was the first negative print since late 2016. It’s also its biggest MoM drop in its history.
Not to be outdone, homebuilder sentiment slipped for the first time this year, indicating that lower mortgage rates have not had the desired effect of boosting the housing market. Of course, we need to keep in mind that property prices remain out of reach for many buyers.
As I mentioned Friday, I expect this non-directional meandering in the markets to continue until the Fed’s release on interest rate policy this Wednesday at 11 am PST. No matter what their verdict is, I don’t think they will be able to meet the high expectations (1. Lower rates, 2. ASAP) Wall Street has put on them.
2. ETFs in the Spotlight
In case you missed the announcement and description of this section, you can read it here again.
It features 10 broadly diversified and sector ETFs from my HighVolume list as posted every Saturday. Furthermore, they are screened for the lowest MaxDD% number meaning they have been showing better resistance to temporary sell offs than all others over the past year.
The below table simply demonstrates the magnitude with which some of the ETFs are fluctuating regarding their positions above or below their respective individual trend lines (%+/-M/A). A break below, represented by a negative number, shows weakness, while a break above, represented by a positive percentage, shows strength.
For hundreds of ETF choices, be sure to reference Thursday’s StatSheet.
For this current domestic “Buy” cycle, here’s how some our candidates have fared:
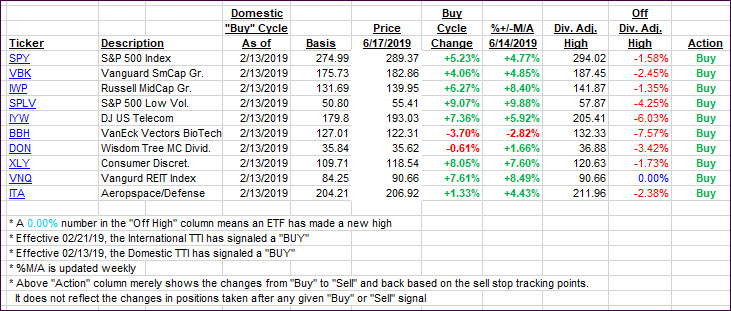
Again, the %+/-M/A column above shows the position of the various ETFs in relation to their respective long-term trend lines, while the trailing sell stops are being tracked in the “Off High” column. The “Action” column will signal a “Sell” once the -8% point has been taken out in the “Off High” column. For more volatile sector ETFs, the trigger point is -10%.
3. Trend Tracking Indexes (TTIs)
Our Trend Tracking Indexes (TTIs) were mixed with Domestic one losing, while the International one gained just a tad, which was not enough to make any changes to that ‘Sell’ cycle. I expect to see some more clarity after Fed’s release on interest rate policy.
Here’s how we closed 06/17/2019:
Domestic TTI: +4.39% above its M/A (last close +4.56%)—Buy signal effective 02/13/2019
International TTI: +1.47% above its M/A (last close +1.45%)—Sell signal effective 05/30/2019
Disclosure: I am obliged to inform you that I, as well as my advisory clients, own some of the ETFs listed in the above table. Furthermore, they do not represent a specific investment recommendation for you, they merely show which ETFs from the universe I track are falling within the specified guidelines.
Contact Ulli