
1. Moving the markets
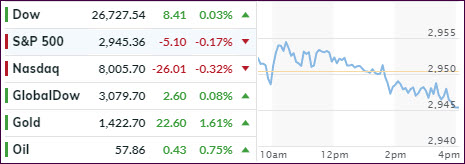
As was to be expected, the major indexes wandered aimlessly slightly above and below their respective unchanged lines with only the Dow being able to eke out a green close.
With no news from the Fed expected, and the G-20 meeting on deck next weekend in Japan, we may seem some more bobbing and weaving and a lackluster view until a new driver appears and drives equities higher.
Trump and his Chinese counterpart Xi are set to meet on Friday and Saturday with traders worldwide looking for signs of a truce, as global markets are struggling with lack of growth prospects. These already have impacted various economies negatively, even those that are considered economic export powerhouses like Germany. Their forecasted GDP is down to an anemic 0.6%.
Even worldwide negative bond yields have not done much to stem the southerly tide in economic activity, while here in the US, the White House is trying to push the Fed to implement lower rates.
Why? The state of the current economy is so poor, that only continued stimulus will be able to keep things moving and assist in keeping equities at elevated levels. We saw what happened in 2018 when stimulus was dropped, and the markets crashed.
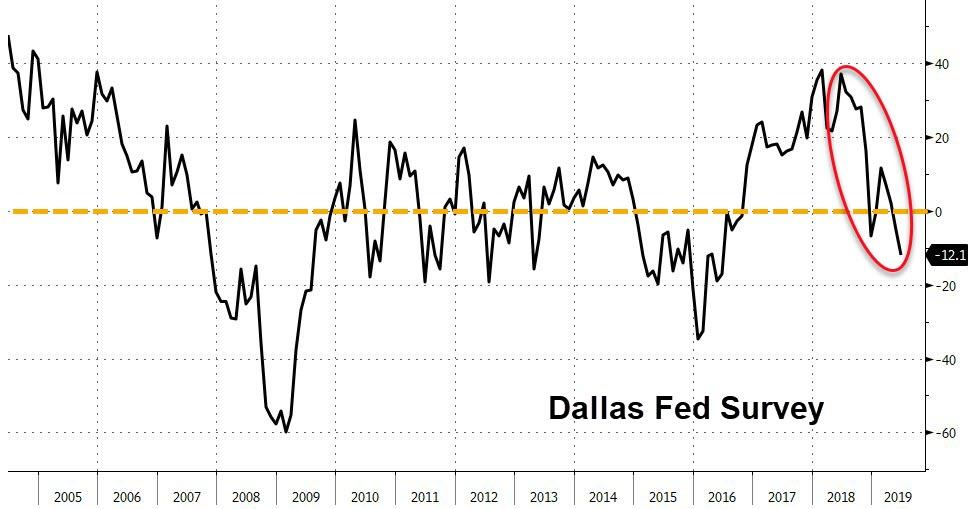
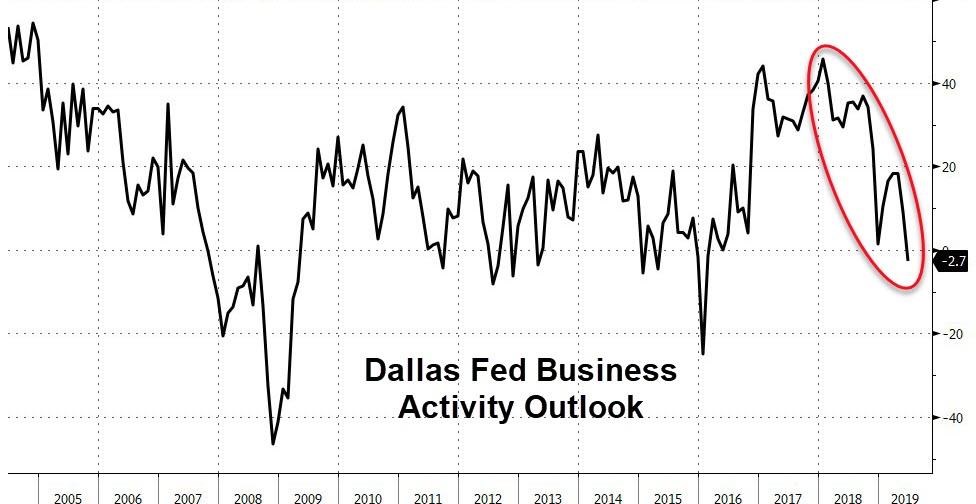
My view is confirmed by the latest data showing that the Dallas Fed Manufacturing survey collapsed from -5.3 to -12.1, while the Activity Outlook, aka ‘hope,’ has plunged into negative numbers.
In other words, things are continuing to slow down, which makes me wonder what the justification for these elevated stock prices is. But, as I said before ‘bonds’ represent the smart money, and their crashing yields are indicative of what’s coming. Equities have simply not priced in any bad news on earnings and the economy.
2. ETFs in the Spotlight
In case you missed the announcement and description of this section, you can read it here again.
It features 10 broadly diversified and sector ETFs from my HighVolume list as posted every Saturday. Furthermore, they are screened for the lowest MaxDD% number meaning they have been showing better resistance to temporary sell offs than all others over the past year.
The below table simply demonstrates the magnitude with which some of the ETFs are fluctuating regarding their positions above or below their respective individual trend lines (%+/-M/A). A break below, represented by a negative number, shows weakness, while a break above, represented by a positive percentage, shows strength.
For hundreds of ETF choices, be sure to reference Thursday’s StatSheet.
For this current domestic “Buy” cycle, here’s how some our candidates have fared:
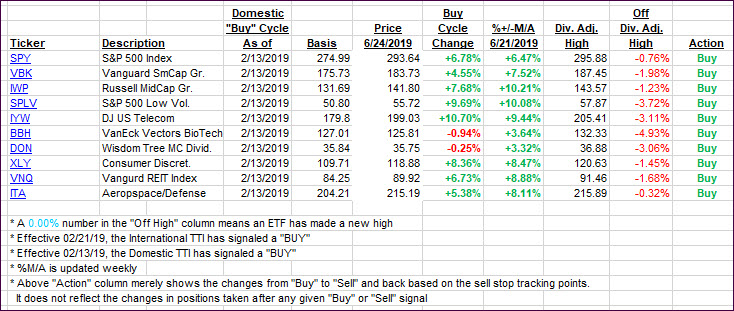
Again, the %+/-M/A column above shows the position of the various ETFs in relation to their respective long-term trend lines, while the trailing sell stops are being tracked in the “Off High” column. The “Action” column will signal a “Sell” once the -8% point has been taken out in the “Off High” column. For more volatile sector ETFs, the trigger point is -10%.
3. Trend Tracking Indexes (TTIs)
Our Trend Tracking Indexes (TTIs) both slipped as the markets went nowhere.
Here’s how we closed 06/24/2019:
Domestic TTI: +5.52% above its M/A (last close +6.46%)—Buy signal effective 02/13/2019
International TTI: +4.25% above its M/A (last close +4.32%)—Buy signal effective 06/19/2019
Disclosure: I am obliged to inform you that I, as well as my advisory clients, own some of the ETFs listed in the above table. Furthermore, they do not represent a specific investment recommendation for you, they merely show which ETFs from the universe I track are falling within the specified guidelines.
Contact Ulli