
- Moving the markets
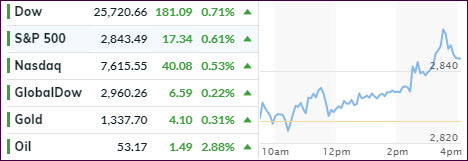
Despite an early struggle for direction, bullish momentum picked up with the major indexes notching another day of gains making this the third winning session in a row.
The trade battles with China and Mexico continued unabated but mixed news was put simply on the back burner. Traders decided to put their focus instead on something more hopeful, namely that the Fed could deliver an interest rate cut and not follow the ECB, which postponed any monetary changes till next year.
It was this type of wishful thinking that supported upside market momentum and kept the bears in check, despite the threat of Mexican tariff going into effect next Monday. Trump said that despite ongoing negotiations “not nearly enough” progress has been made.
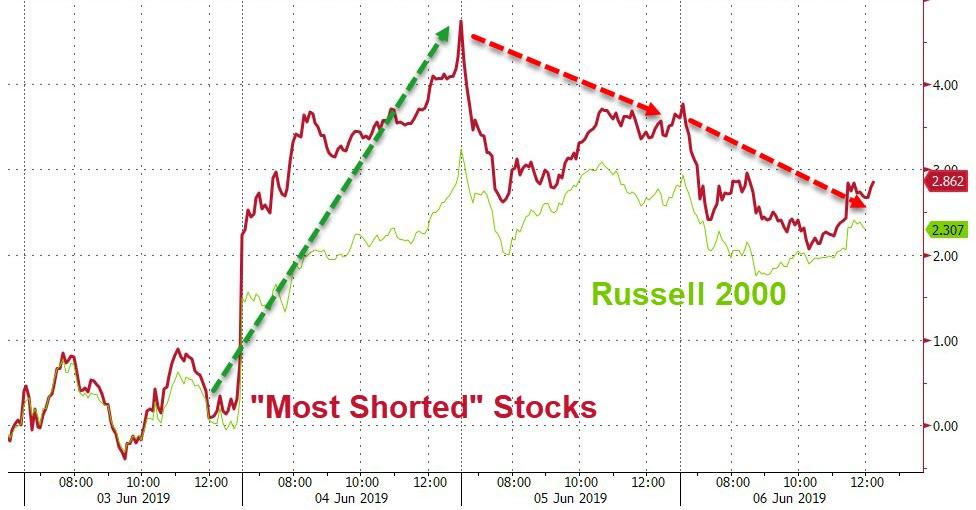
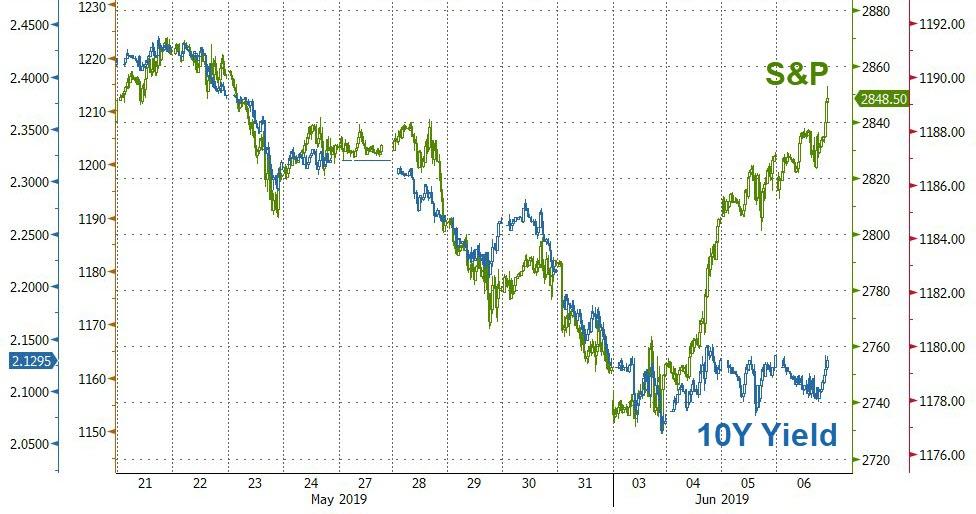
The most shorted stocks were left alone by traders for the second day in a row thereby not contributing to this winning session. Bond yields were steady with the 10-year barely nudging but, in the bigger picture, the decoupling of its yield vs. the S&P 500 remains extreme, as this graph shows.
Our International TTI managed to conquer its long-term trend line, but only by a tiny margin (see section 3), which was not significant enough to consider this a reversal of the recent downtrend—yet.
2. ETFs in the Spotlight
In case you missed the announcement and description of this section, you can read it here again.
It features 10 broadly diversified and sector ETFs from my HighVolume list as posted every Saturday. Furthermore, they are screened for the lowest MaxDD% number meaning they have been showing better resistance to temporary sell offs than all others over the past year.
The below table simply demonstrates the magnitude with which some of the ETFs are fluctuating regarding their positions above or below their respective individual trend lines (%+/-M/A). A break below, represented by a negative number, shows weakness, while a break above, represented by a positive percentage, shows strength.
For hundreds of ETF choices, be sure to reference Thursday’s StatSheet.
For this current domestic “Buy” cycle, here’s how some our candidates have fared:
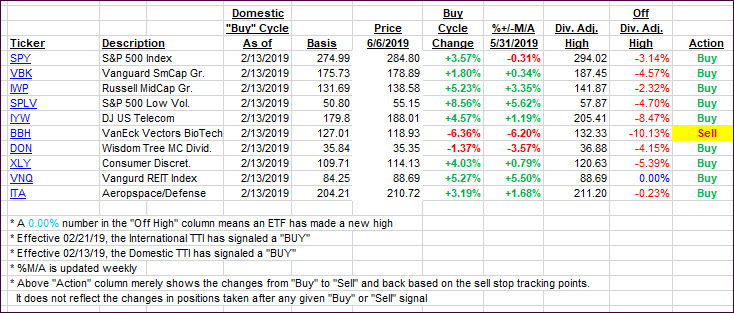
Again, the %+/-M/A column above shows the position of the various ETFs in relation to their respective long-term trend lines, while the trailing sell stops are being tracked in the “Off High” column. The “Action” column will signal a “Sell” once the -8% point has been taken out in the “Off High” column. For more volatile sector ETFs, the trigger point is -10%.
3. Trend Tracking Indexes (TTIs)
Our Trend Tracking Indexes (TTIs) improved again with the International one having crawled back above its long-term trend line, but only by a tiny fraction. Again, I will wait for more upside confirmation before calling this recent downtrend to be over.
Here’s how we closed 06/06/2019:
Domestic TTI: +3.49% above its M/A (last close +2.98%)—Buy signal effective 02/13/2019
International TTI: +0.05% above its M/A (last close -0.18%)—Sell signal effective 05/30/2019
Disclosure: I am obliged to inform you that I, as well as my advisory clients, own some of the ETFs listed in the above table. Furthermore, they do not represent a specific investment recommendation for you, they merely show which ETFs from the universe I track are falling within the specified guidelines.
Contact Ulli