
ETF Tracker StatSheet
You can view the latest version here.
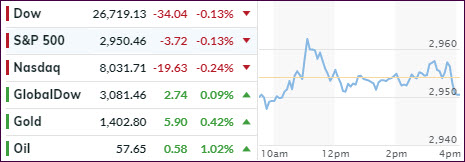
A SLOW FINISH ENDS A STRONG WEEK
1. Moving the markets
Quadruple witching day occupied the traders on Wall Street, as the 3rd Friday of every quarter can produce added volatility due to the simultaneous expiration of single-stock options and futures and index options and futures.
A mid-morning sudden spike was not caused by any option juggling but was merely a reaction to VP Pence’s conciliatory comments about the trade meeting. It did not take long for the Chinese to pour some cold water on his remarks via things like “the Chinese side is concerned about the fairness of a trade deal,” followed by “the US side must remove all newly imposed tariffs.”
This took the starch out of the upward move, and the Pence spike was erased in short order. The major indexes managed to tightly roam around their respective unchanged lines for the remainder of the session, seemingly unfazed by another set of weak econ data. A dive into the close pulled us back into the red, but the losses were minor. However, for the week, the S&P 500 managed a gain of some 2.2%.
We learned that existing home sales continued their downward spiral, as the rise of 2.5% MoM in May does not tell the entire story. When looking at it longer term, this data set has tumbled YoY for the 15th month, which is the worst since the housing crisis.
At the same time, US manufacturing (PMI) plunged to 10-year lows in June, with both indexes (Manufacturing and Services) edging closer to contraction.
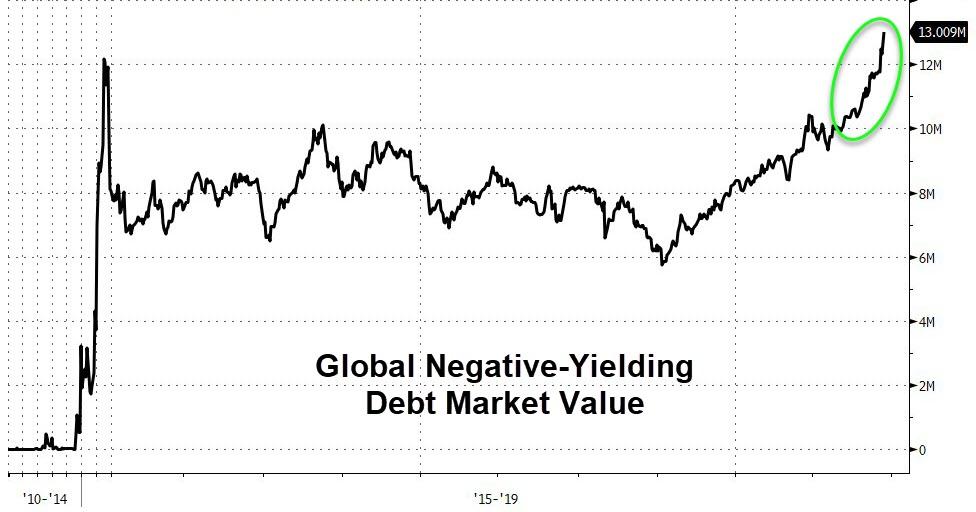
Since bond yields have been getting most of the attention lately, as the 10-year is threatening to drop below the 2% level, worldwide, the picture looks even gloomier. Global negative yielding debt soared by $700 billion in one day to a record $13 trillion.
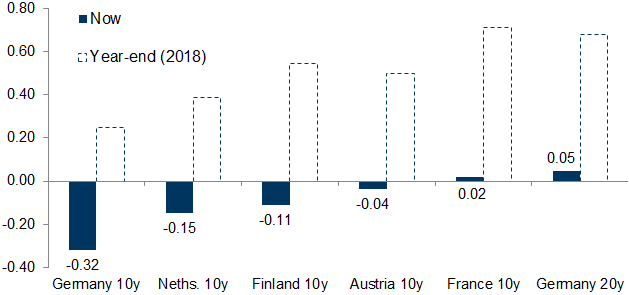
Look at the yield disaster that Europe is showing, especially when you review the comparative data as of year-end 2018. This kind of a collapse in yields is not a bullish indicator. It’s the opposite, as it clearly points to collapsing global growth and a potential slide into a recession.
Makes me wonder when the equity markets will figure this out…
In the meantime, we will ride this trend until it ends, when it bends and our Trend Tracking Indexes (TTIs) signal to get us out of equities and to the safety of the sidelines.
2. ETFs in the Spotlight
In case you missed the announcement and description of this section, you can read it here again.
It features 10 broadly diversified and sector ETFs from my HighVolume list as posted every Saturday. Furthermore, they are screened for the lowest MaxDD% number meaning they have been showing better resistance to temporary sell offs than all others over the past year.
The below table simply demonstrates the magnitude with which some of the ETFs are fluctuating regarding their positions above or below their respective individual trend lines (%+/-M/A). A break below, represented by a negative number, shows weakness, while a break above, represented by a positive percentage, shows strength.
For hundreds of ETF choices, be sure to reference Thursday’s StatSheet.
For this current domestic “Buy” cycle, here’s how some our candidates have fared:
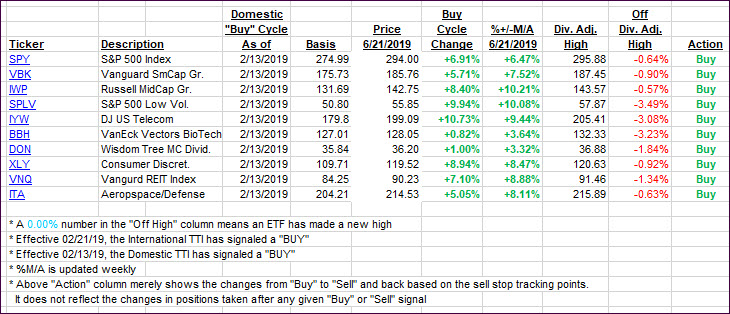
Again, the %+/-M/A column above shows the position of the various ETFs in relation to their respective long-term trend lines, while the trailing sell stops are being tracked in the “Off High” column. The “Action” column will signal a “Sell” once the -8% point has been taken out in the “Off High” column. For more volatile sector ETFs, the trigger point is -10%.
3. Trend Tracking Indexes (TTIs)
Our Trend Tracking Indexes (TTIs) were mixed with the Domestic one retreating, while the International one gained.
Here’s how we closed 06/21/2019:
Domestic TTI: +6.46% above its M/A (last close +6.73%)—Buy signal effective 02/13/2019
International TTI: +4.32% above its M/A (last close +4.16%)—Buy signal effective 06/19/2019
Disclosure: I am obliged to inform you that I, as well as my advisory clients, own some of the ETFs listed in the above table. Furthermore, they do not represent a specific investment recommendation for you, they merely show which ETFs from the universe I track are falling within the specified guidelines.
———————————————————-
WOULD YOU LIKE TO HAVE YOUR INVESTMENTS PROFESSIONALLY MANAGED?
Do you have the time to follow our investment plans yourself? If you are a busy professional who would like to have his portfolio managed using our methodology, please contact me directly or get more details here.
———————————————————
Back issues of the ETF Tracker are available on the web.
Contact Ulli