

1. Moving the markets
Equities managed a small rebound, after 2 days of modest losses kept the major indexes in check. Oil prices spiked as two oil tankers were damaged in suspected attacks off the coast of Iran, increasing tensions between Teheran and Washington.
Of course, by default, no matter if it makes sense or not, Iran is suspected to be the guilty party—at least for the time being. Be that as it may, the energy sector was the beneficiary of this event with Crude Oil reclaiming its $52 marker.
Trade tensions with China saw a tiny positive development when Trump mentioned that he “doesn’t have a deadline” for imposing additional tariffs and adding that he had a “feeling” a deal could be reached. I am sure, the jawboning is far from being over…
In the end, it turned out to be a roller coaster ride, with the major indexes giving back most of their early gains. However, during the last 30 minutes of trading, a sudden burst of upward momentum pushed the indexes close to the opening high, but the Nasdaq was unable to get back above its 50-day M/A.
There was not much gained or lost regarding our Trend Tracking Indexes (TTIs).
2. ETFs in the Spotlight
In case you missed the announcement and description of this section, you can read it here again.
It features 10 broadly diversified and sector ETFs from my HighVolume list as posted every Saturday. Furthermore, they are screened for the lowest MaxDD% number meaning they have been showing better resistance to temporary sell offs than all others over the past year.
The below table simply demonstrates the magnitude with which some of the ETFs are fluctuating regarding their positions above or below their respective individual trend lines (%+/-M/A). A break below, represented by a negative number, shows weakness, while a break above, represented by a positive percentage, shows strength.
For hundreds of ETF choices, be sure to reference Thursday’s StatSheet.
For this current domestic “Buy” cycle, here’s how some our candidates have fared:
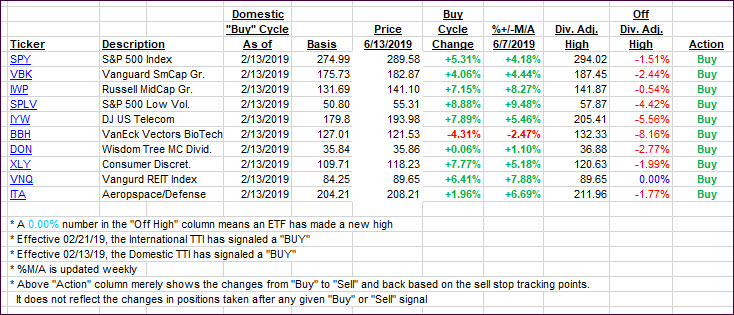
Again, the %+/-M/A column above shows the position of the various ETFs in relation to their respective long-term trend lines, while the trailing sell stops are being tracked in the “Off High” column. The “Action” column will signal a “Sell” once the -8% point has been taken out in the “Off High” column. For more volatile sector ETFs, the trigger point is -10%.
3. Trend Tracking Indexes (TTIs)
Our Trend Tracking Indexes (TTIs) gained with the Domestic one showing more strength than the International one, where I am still holding off on a new ‘Buy’ as previously discussed.
Here’s how we closed 06/13/2019:
Domestic TTI: +4.84% above its M/A (last close +4.23%)—Buy signal effective 02/13/2019
International TTI: +1.79% above its M/A (last close +1.68%)—Sell signal effective 05/30/2019
Disclosure: I am obliged to inform you that I, as well as my advisory clients, own some of the ETFs listed in the above table. Furthermore, they do not represent a specific investment recommendation for you, they merely show which ETFs from the universe I track are falling within the specified guidelines.
Contact Ulli