
1. Moving the markets
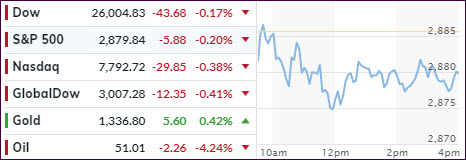
Upward momentum was conspicuously absent during this session, which had stocks drift aimlessly lower, interrupted by the occasional bounce to nowhere. The major indexes followed yesterday’s theme by slipping moderately.
On the menu was the Consumer Price Index (CPI), which showed prices advancing by an expected +0.1% in April, while the cost of living over the past year slowed to 1.8% from 2%. This slowing of price growth was another feather in the cap of those hoping that the Fed will cut rates sooner rather than later.
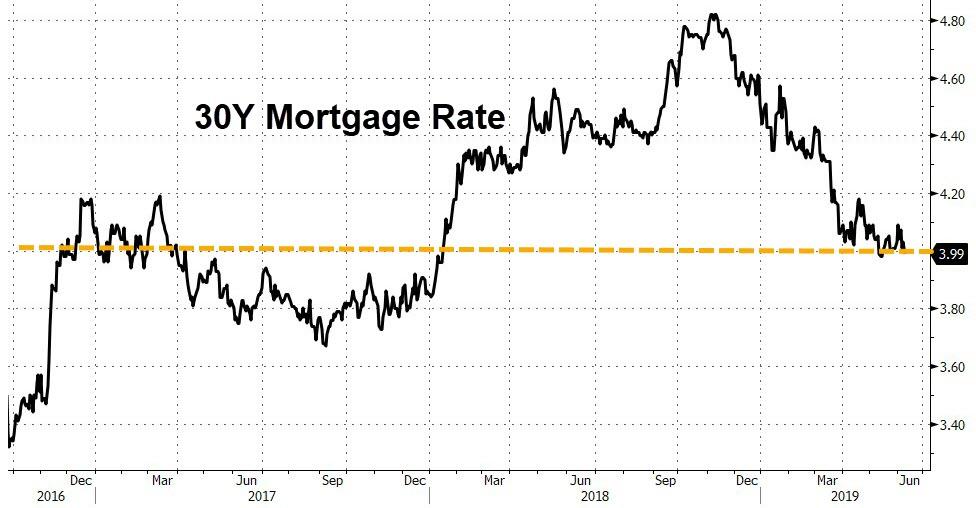
The already declining bonds yields, as well as mortgage rates, have created a new Refi boom, as mortgage applications surged impressively by 26.8% WoW, which was its largest jump since 2015. 30-year rates have now tumbled below 4%, a level last seen in January 2019.
Regarding China, Trump came out and said that he was the one “holding up a trade deal with China,” adding that the two countries would “either do a great deal…or we’re not doing a deal at all.”
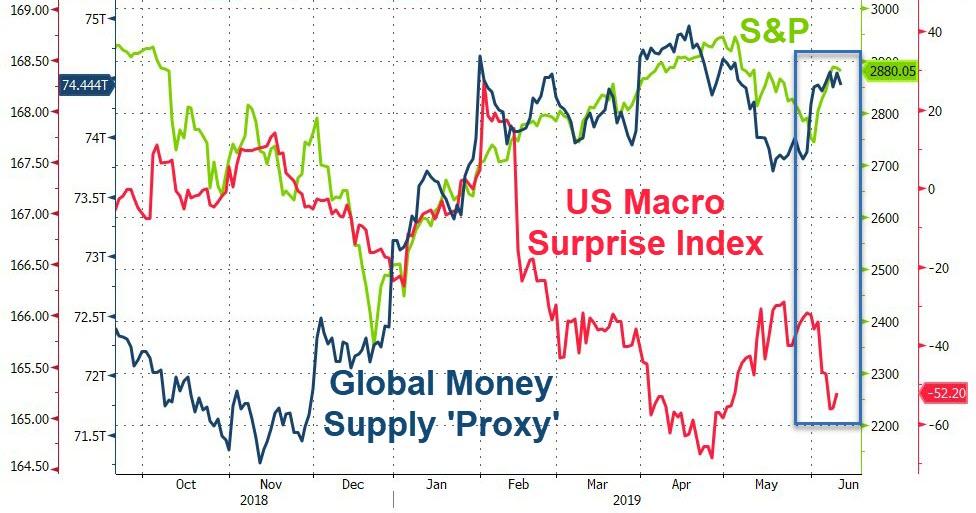
You may be wondering what, other than Fed jawboning, has been driving stocks higher during the past week, but this chart (thanks to ZH) clearly shows that, after an interruption in May, the global money supply has been rising again and thereby lifted stocks out of the May doldrums.
2. ETFs in the Spotlight
In case you missed the announcement and description of this section, you can read it here again.
It features 10 broadly diversified and sector ETFs from my HighVolume list as posted every Saturday. Furthermore, they are screened for the lowest MaxDD% number meaning they have been showing better resistance to temporary sell offs than all others over the past year.
The below table simply demonstrates the magnitude with which some of the ETFs are fluctuating regarding their positions above or below their respective individual trend lines (%+/-M/A). A break below, represented by a negative number, shows weakness, while a break above, represented by a positive percentage, shows strength.
For hundreds of ETF choices, be sure to reference Thursday’s StatSheet.
For this current domestic “Buy” cycle, here’s how some our candidates have fared:
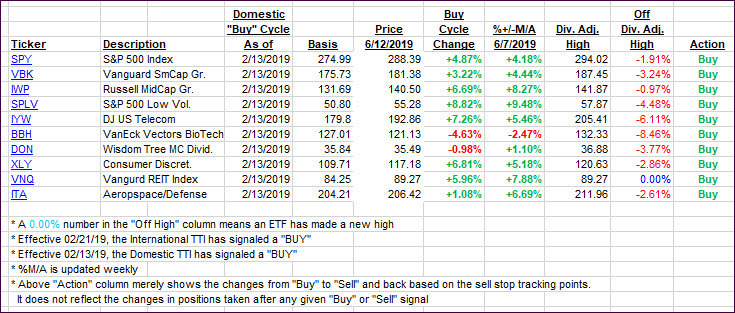
Again, the %+/-M/A column above shows the position of the various ETFs in relation to their respective long-term trend lines, while the trailing sell stops are being tracked in the “Off High” column. The “Action” column will signal a “Sell” once the -8% point has been taken out in the “Off High” column. For more volatile sector ETFs, the trigger point is -10%.
3. Trend Tracking Indexes (TTIs)
Our Trend Tracking Indexes (TTIs) both slipped with the International one taking a bigger hit than its domestic cousin. I will continue to be patient by looking for more staying power before issuing a new ‘Buy’ for that sector.
Here’s how we closed 06/12/2019:
Domestic TTI: +4.23% above its M/A (last close +4.36%)—Buy signal effective 02/13/2019
International TTI: +1.68% above its M/A (last close +2.09%)—Sell signal effective 05/30/2019
Disclosure: I am obliged to inform you that I, as well as my advisory clients, own some of the ETFs listed in the above table. Furthermore, they do not represent a specific investment recommendation for you, they merely show which ETFs from the universe I track are falling within the specified guidelines.
Contact Ulli