
- Moving the markets
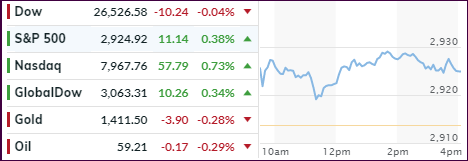
Boeing put a dent into the Dow’s performance today, which lagged as a result of news that the 737 MAX airplane has a “glitch” that could send it into an “uncontrollable” nosedive. That sent the shares tumbling early on, but they ended up stabilizing and finishing with a minor loss of some -2.5%.
The other two major indexes managed to close in the green with the S&P 500 finally rising after four days of declines. Still, the index is on track to have its best month since January, after the rout in May during which it tanked -6.6%.
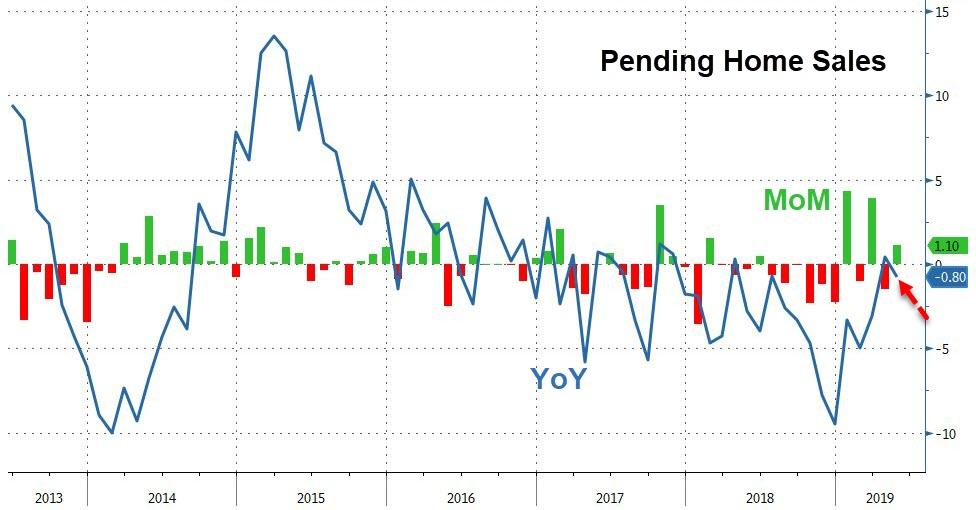
Throughout the session, the Nasdaq and S&P managed to hold steady, despite more shaky economic news. We learned that Pending Home Sales on a YoY basis contracted by -0.8% despite lower mortgage rates, but they surprised to the upside in May (+1.1%).
In the automobile sector, the ‘carmageddon’ continues with Ford announcing some 12,000 layoffs at various manufacturing plants in Europe. This is part of a massive cost cutting plan that would also shutter 6 of its 24 facilities by the end of 2000.
Here in the US, traders are nervously awaiting the outcome of the G-20 meeting, mainly regarding a possible trade deal with China, as the jawboning between the warring parties has shifted into high gear.
It’s a different day, but the same old threats of pre-conditions and additional tariffs. We’ll find out initial market reaction on Sunday night, when the futures markets open.
2. ETFs in the Spotlight
In case you missed the announcement and description of this section, you can read it here again.
It features 10 broadly diversified and sector ETFs from my HighVolume list as posted every Saturday. Furthermore, they are screened for the lowest MaxDD% number meaning they have been showing better resistance to temporary sell offs than all others over the past year.
The below table simply demonstrates the magnitude with which some of the ETFs are fluctuating regarding their positions above or below their respective individual trend lines (%+/-M/A). A break below, represented by a negative number, shows weakness, while a break above, represented by a positive percentage, shows strength.
For hundreds of ETF choices, be sure to reference Thursday’s StatSheet.
For this current domestic “Buy” cycle, here’s how some our candidates have fared:
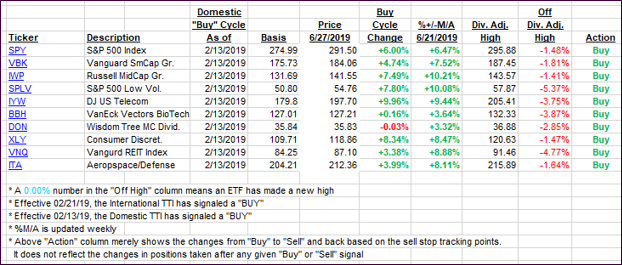
Again, the %+/-M/A column above shows the position of the various ETFs in relation to their respective long-term trend lines, while the trailing sell stops are being tracked in the “Off High” column. The “Action” column will signal a “Sell” once the -8% point has been taken out in the “Off High” column. For more volatile sector ETFs, the trigger point is -10%.
3. Trend Tracking Indexes (TTIs)
Our Trend Tracking Indexes (TTIs) headed north, as two out of the major indexes managed to close in the green.
Here’s how we closed 06/27/2019:
Domestic TTI: +5.37% above its M/A (last close +4.71%)—Buy signal effective 02/13/2019
International TTI: +3.69% above its M/A (last close +3.35%)—Buy signal effective 06/19/2019
Disclosure: I am obliged to inform you that I, as well as my advisory clients, own some of the ETFs listed in the above table. Furthermore, they do not represent a specific investment recommendation for you, they merely show which ETFs from the universe I track are falling within the specified guidelines.
Contact Ulli