
1. Moving the markets
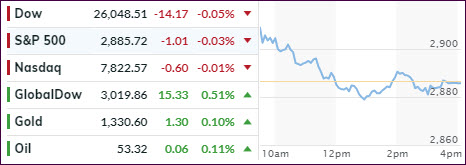
Despite another positive start to the session, equities struggled, lost traction and slid into the red, with the major indexes hugging their respective unchanged lines and closing a tad below it.
Powering the markets early on were reports from China announcing plans for fresh stimulus to keep their economy running. Hope among traders was high that an easing of trade tensions might be on deck, yet later renewed posturing between the U.S. and China supported the view that the standoff will continue.
In the end, none of these headlines provided enough ammo
to keep the indexes in the green. It appears to me that the trade tensions will
escalate further but will be interrupted from time to time by hope of a
resolution, which will then temporarily support a market bounce.
Right now, expectations are that the Fed will please Wall Street next Wednesday, when they announce their decision on interest rates. Until then, we may see some aimless meandering in the indexes until it becomes clear as to what the verdict might be.
2. ETFs in the Spotlight
In case you missed the announcement and description of this section, you can read it here again.
It features 10 broadly diversified and sector ETFs from my HighVolume list as posted every Saturday. Furthermore, they are screened for the lowest MaxDD% number meaning they have been showing better resistance to temporary sell offs than all others over the past year.
The below table simply demonstrates the magnitude with which some of the ETFs are fluctuating regarding their positions above or below their respective individual trend lines (%+/-M/A). A break below, represented by a negative number, shows weakness, while a break above, represented by a positive percentage, shows strength.
For hundreds of ETF choices, be sure to reference Thursday’s StatSheet.
For this current domestic “Buy” cycle, here’s how some our candidates have fared:
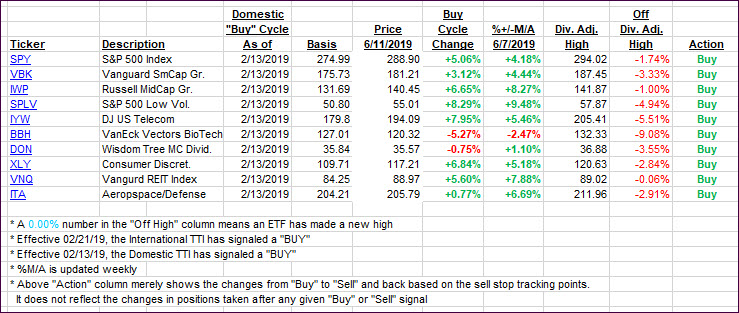
Again, the %+/-M/A column above shows the position of the various ETFs in relation to their respective long-term trend lines, while the trailing sell stops are being tracked in the “Off High” column. The “Action” column will signal a “Sell” once the -8% point has been taken out in the “Off High” column. For more volatile sector ETFs, the trigger point is -10%.
3. Trend Tracking Indexes (TTIs)
Our Trend Tracking Indexes (TTIs) showed a mixed picture with the Domestic one slipping while the International gained for the 4th day. While it’s reached a decent level above the line, it did so very quickly and without having shown me any staying power yet. In order to avoid a possible whip-saw signal, I will hold off a little longer before issuing a new ‘Buy’ signal.
Here’s how we closed 06/11/2019:
Domestic TTI: +4.36% above its M/A (last close +4.47%)—Buy signal effective 02/13/2019
International TTI: +2.09% above its M/A (last close +1.58%)—Sell signal effective 05/30/2019
Disclosure: I am obliged to inform you that I, as well as my advisory clients, own some of the ETFs listed in the above table. Furthermore, they do not represent a specific investment recommendation for you, they merely show which ETFs from the universe I track are falling within the specified guidelines.
Contact Ulli