
- Moving the markets
It was clear to me on Sunday afternoon, that today would be bad day in the markets when China’s Premier Liu He tweeted that China is planning to retaliate, and three core concerns would have to be addressed:
China has made public 3 core concerns that must be addressed &it won’t make concessions on. From perspective of China’s politics, there is little room for compromises. They will insist. This political logic won’t be changed no matter how much additional tariffs the US will impose.
Trump did not back down and upped the ante with:
….The only problem is that they know I am going to win (best economy & employment numbers in U.S. history, & much more), and the deal will become far worse for them if it has to be negotiated in my second term. Would be wise for them to act now, but love collecting BIG TARIFFS!
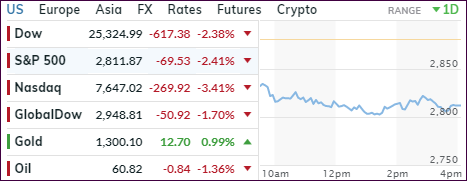
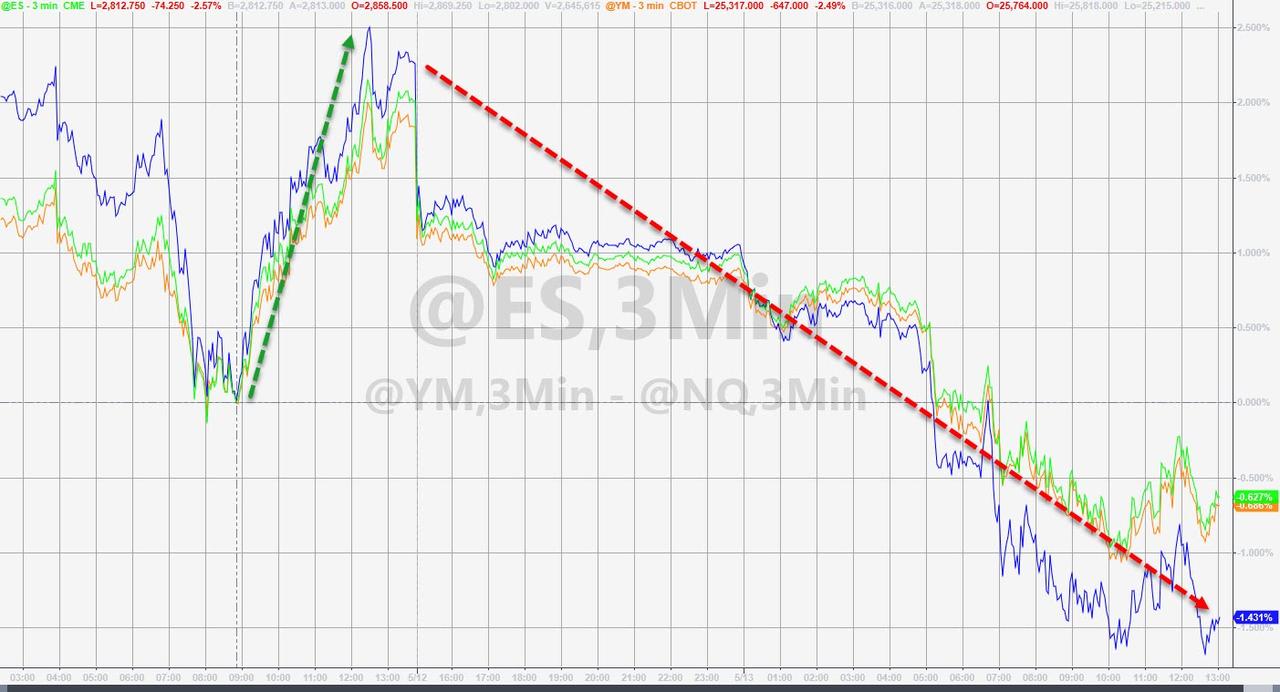
That pretty much set the negative tone in the futures market, and subsequently at the opening of the regular session this morning, with the major indexes doing their best imitation of a swan dive.
Since the beginning of the year, markets had priced in a best-case trade scenario, helping the rebound rally going. That theme has now, however, shifted towards a worst-case scenario pushing up volatility and giving the bears the upper hand.
The shock that trade retaliation materialized, will most likely change the bullish theme we’ve witnessing since Christmas. Unless, of course, the Fed changes its mind again and follows the White House’s suggestion to lower interest rates by a full 1%. Then we could see a sudden reversal in sentiment and, at least temporarily, a resumption of the prior uptrend.
It was an ugly day with the Dow being down some 700 points but managed to crawl off its lows thanks to selected jawboning by Mnuchin and Trump. ZH reports that this was not only the worst day for stocks since January 2nd, but we’re also marching towards the worst May in 50 years.
The losses were broad with the FANG stocks getting hammered, while AAPL gapped down and got smashed below its 200-day M/A.
Bond yields dropped helping the low volatility ETFs, like SPLV, hold up far better than the indexes. To wit, SPY lost -2.51%, while SPLV gave back a modest -0.64%.
None of our trailing sell stops were triggered, but the International TTI pierced its long-term trend line to the downside by -0.66%. I will wait and see if this drop into bearish territory will hold before issuing a ‘Sell’ signal for that arena.
2. ETFs in the Spotlight
In case you missed the announcement and description of this section, you can read it here again.
It features 10 broadly diversified and sector ETFs from my HighVolume list as posted every Saturday. Furthermore, they are screened for the lowest MaxDD% number meaning they have been showing better resistance to temporary sell offs than all others over the past year.
The below table simply demonstrates the magnitude with which some of the ETFs are fluctuating regarding their positions above or below their respective individual trend lines (%+/-M/A). A break below, represented by a negative number, shows weakness, while a break above, represented by a positive percentage, shows strength.
For hundreds of ETF choices, be sure to reference Thursday’s StatSheet.
For this current domestic “Buy” cycle, here’s how some our candidates have fared:
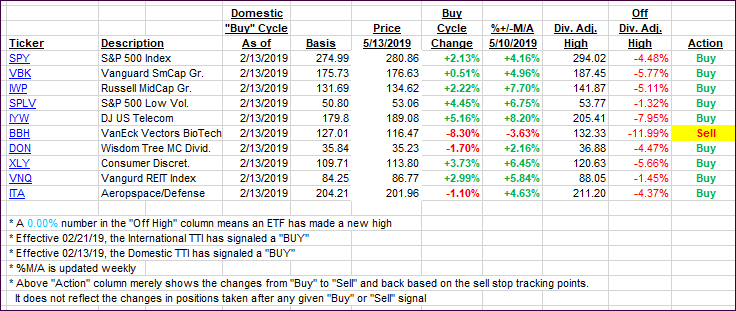
Again, the %+/-M/A column above shows the position of the various ETFs in relation to their respective long-term trend lines, while the trailing sell stops are being tracked in the “Off High” column. The “Action” column will signal a “Sell” once the -8% point has been taken out in the “Off High” column. For more volatile sector ETFs, the trigger point is -10%.
3. Trend Tracking Indexes (TTIs)
Our Trend Tracking Indexes (TTIs) headed south with the International one dropping into bearish territory. As mentioned above, I will wait a few days to see if this turnaround is more than an outlier before declaring this bullish cycle to be over.
Here’s how we closed 05/13/2019:
Domestic TTI: +1.83% above its M/A (last close +4.43%)—Buy signal effective 02/13/2019
International TTI: -0.66% above its M/A (last close +1.02%)—Buy signal effective 02/21/2019
Disclosure: I am obliged to inform you that I, as well as my advisory clients, own some of the ETFs listed in the above table. Furthermore, they do not represent a specific investment recommendation for you, they merely show which ETFs from the universe I track are falling within the specified guidelines.
Contact Ulli