
- Moving the markets
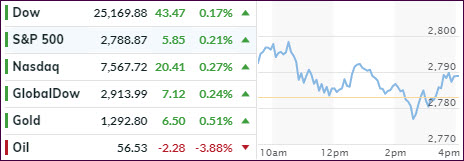
For a change, the markets opened slightly to the upside, before a slow and steady decline pulled the major indexes into the red, however, a last hour buying effort saved the day and we ended up modestly in the green.
While the trade war battle continued in full swing, Wall Street traders apparently decided to take a break from the constant stream of news, including the accusation by China that the U.S. uses “naked economic terrorism,” “economic bullying” and the assertion that they will “fight until the end.”
Regarding economic news, we learned that after weakness in new- and existing-home sales in April, the pending ones were expected to do better, but no dice. Instead pending sales slipped -1.5% MoM, its worst decline since the financial crisis in 2008.
The bond market continues to paint an ugly picture with the 10-year yield plunging again after a late rebound yesterday. This prompted ZH to post this chart with the at this point unanswerable question “will the relationship between the S&P 500 and the 10-year yield revert like in 2016 (higher rates) or 2007 (lower equity prices)?”
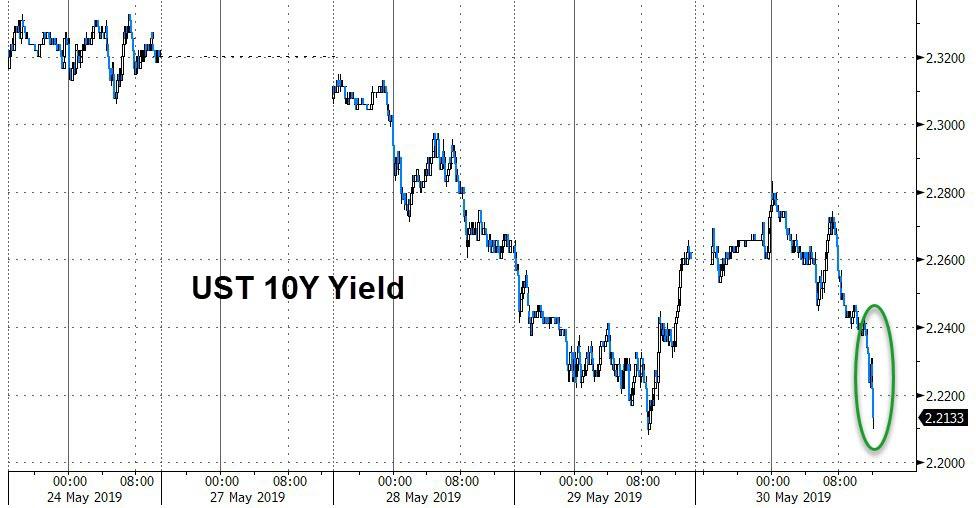
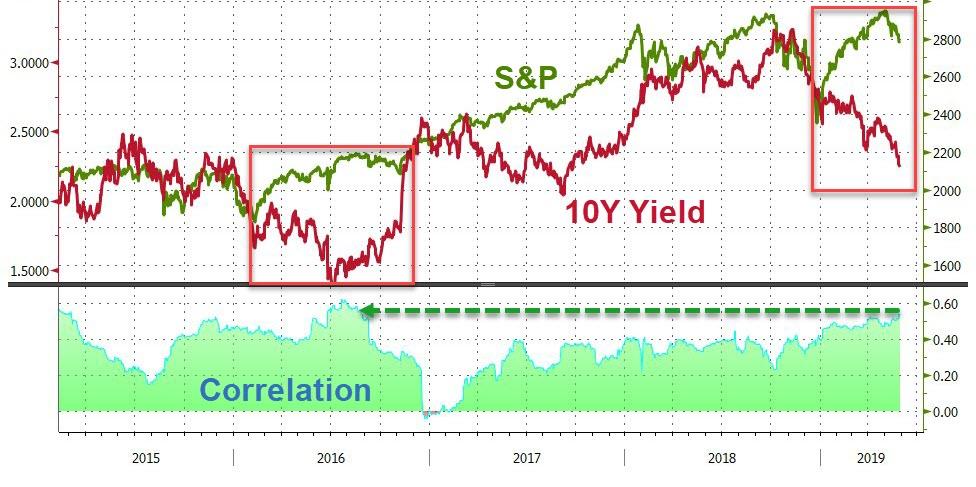
With a little bit of patience, we will find out.
2. ETFs in the Spotlight
In case you missed the announcement and description of this section, you can read it here again.
It features 10 broadly diversified and sector ETFs from my HighVolume list as posted every Saturday. Furthermore, they are screened for the lowest MaxDD% number meaning they have been showing better resistance to temporary sell offs than all others over the past year.
The below table simply demonstrates the magnitude with which some of the ETFs are fluctuating regarding their positions above or below their respective individual trend lines (%+/-M/A). A break below, represented by a negative number, shows weakness, while a break above, represented by a positive percentage, shows strength.
For hundreds of ETF choices, be sure to reference Thursday’s StatSheet.
For this current domestic “Buy” cycle, here’s how some our candidates have fared:
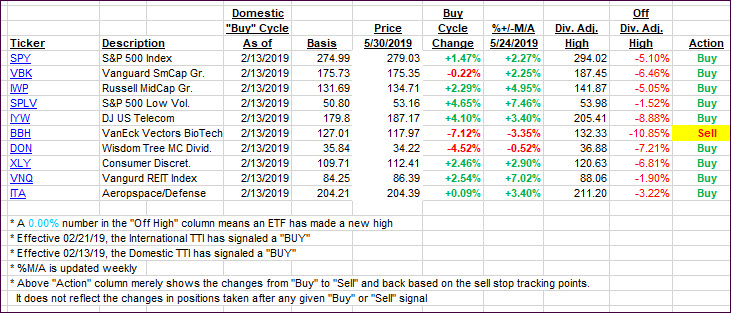
Again, the %+/-M/A column above shows the position of the various ETFs in relation to their respective long-term trend lines, while the trailing sell stops are being tracked in the “Off High” column. The “Action” column will signal a “Sell” once the -8% point has been taken out in the “Off High” column. For more volatile sector ETFs, the trigger point is -10%.
3. Trend Tracking Indexes (TTIs)
Our Trend Tracking Indexes (TTIs) improved slightly, but the Domestic one remains on the cusp of breaking its trend line to the downside.
Here’s how we closed 05/30/2019:
Domestic TTI: +0.37% above its M/A (last close +0.22%)—Buy signal effective 02/13/2019
International TTI: -1.68% below its M/A (last close -1.92%)—Sell signal effective 05/30/2019
Disclosure: I am obliged to inform you that I, as well as my advisory clients, own some of the ETFs listed in the above table. Furthermore, they do not represent a specific investment recommendation for you, they merely show which ETFs from the universe I track are falling within the specified guidelines.
Contact Ulli