
- Moving the markets
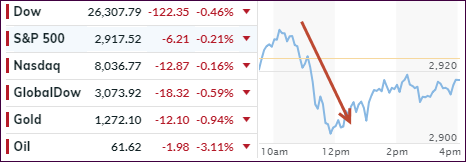
After an early meandering around their respective unchanged lines, the major indexes took a sudden steep dive and quickly red numbers spread across traders’ computer screens.
The scramble to find the culprit was on. Turns out that news by the India press that US-China trade negotiations had hit a brick wall, and thereby an impasse, caused the already nervous Wall Streeters, which were still reeling from the Fed’s “transitory hawkishness,” to push the sell buttons. The Dow dropped some 220 points before finding a bottom.
ZeroHedge, as always tongue-in-cheek, was quick to tweet a suggestion to the White House to resolve this sudden and unexpected market drop:
White House to do list:
1) Unleash the Kudlow
2) call the PPT
3) demand QE
Despite no White House response, the major indexes managed to climb back and cut the early losses in half with the Dow now heading towards its second down week in a row since December 21st.
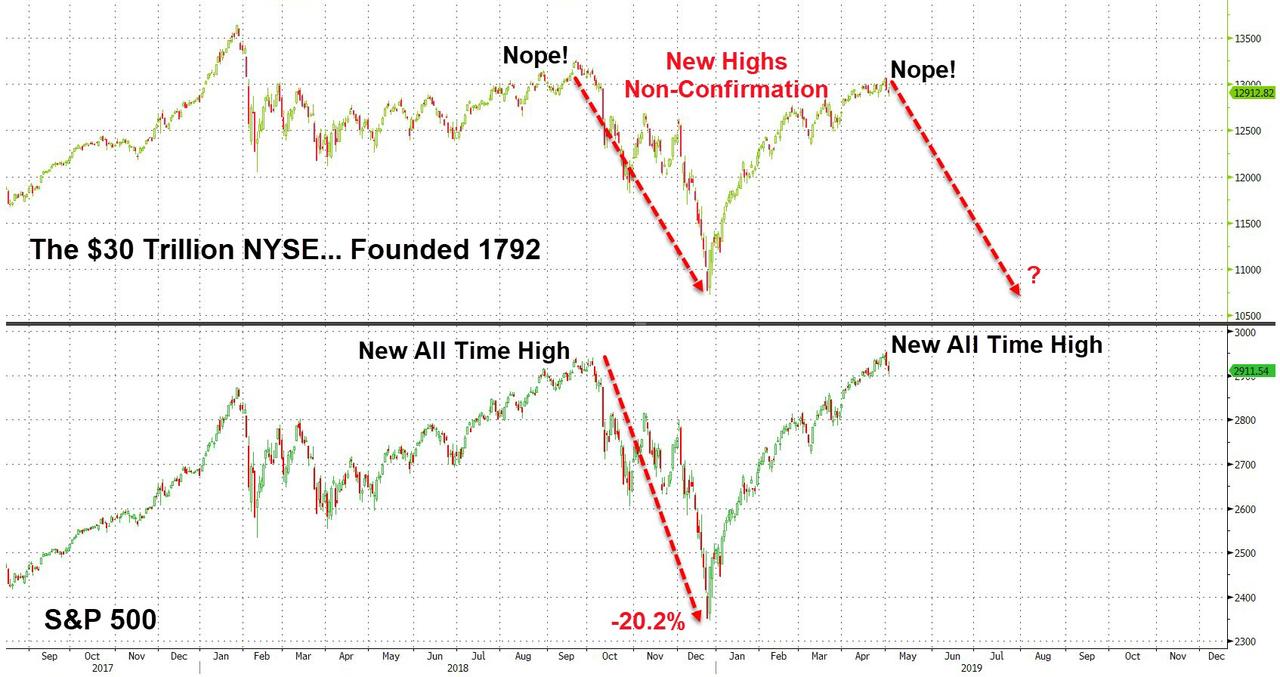
When well-known indexes, such as the S&P 500, make a new all-time high, and there is no confirmation from another well-known index covering the same markets, such as the NYSE, you must wonder if history will repeat itself regarding the subsequent -20% sell-off. ZH posted this chart, leaving open the question as to whether the lack of the NYSE making its new all-time high again could be a bad omen for the S&P 500.
On a personal note, I am out tomorrow and will not be able to write the market commentary nor Saturday’s ‘ETFs on the Cutline’ report. My wife and I will be traveling out of town celebrating my son’s college graduation.
Regular posting will resume on Monday.
- ETFs in the Spotlight
In case you missed the announcement and description of this section, you can read it here again.
It features 10 broadly diversified and sector ETFs from my HighVolume list as posted every Saturday. Furthermore, they are screened for the lowest MaxDD% number meaning they have been showing better resistance to temporary sell offs than all others over the past year.
The below table simply demonstrates the magnitude with which some of the ETFs are fluctuating regarding their positions above or below their respective individual trend lines (%+/-M/A). A break below, represented by a negative number, shows weakness, while a break above, represented by a positive percentage, shows strength.
For hundreds of ETF choices, be sure to reference Thursday’s StatSheet.
For this current domestic “Buy” cycle, here’s how some our candidates have fared:
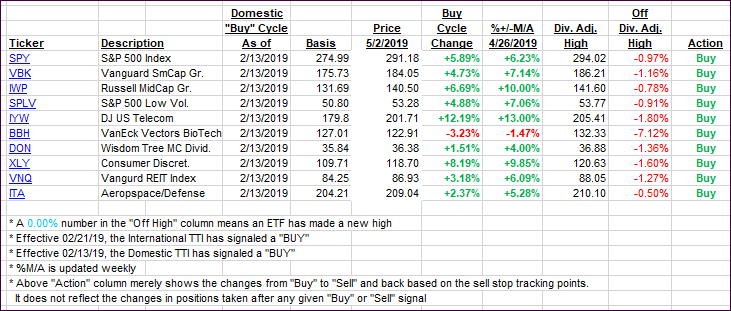
Again, the %+/-M/A column above shows the position of the various ETFs in relation to their respective long-term trend lines, while the trailing sell stops are being tracked in the “Off High” column. The “Action” column will signal a “Sell” once the -8% point has been taken out in the “Off High” column. For more volatile sector ETFs, the trigger point is -10%.
- Trend Tracking Indexes (TTIs)
Our Trend Tracking Indexes (TTIs) showed a mixed picture with the Domestic one inching up a tad, while the International gave back some of its recent advances.
Here’s how we closed 05/02/2019:
Domestic TTI: +5.73% above its M/A (last close +5.72%)—Buy signal effective 02/13/2019
International TTI: +3.53% above its M/A (last close +4.00%)—Buy signal effective 02/21/2019
Disclosure: I am obliged to inform you that I, as well as my advisory clients, own some of the ETFs listed in the above table. Furthermore, they do not represent a specific investment recommendation for you, they merely show which ETFs from the universe I track are falling within the specified guidelines.
Contact Ulli