
- Moving the markets
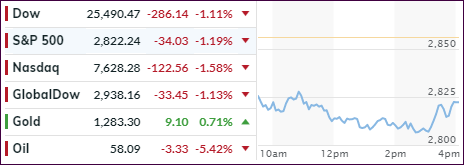
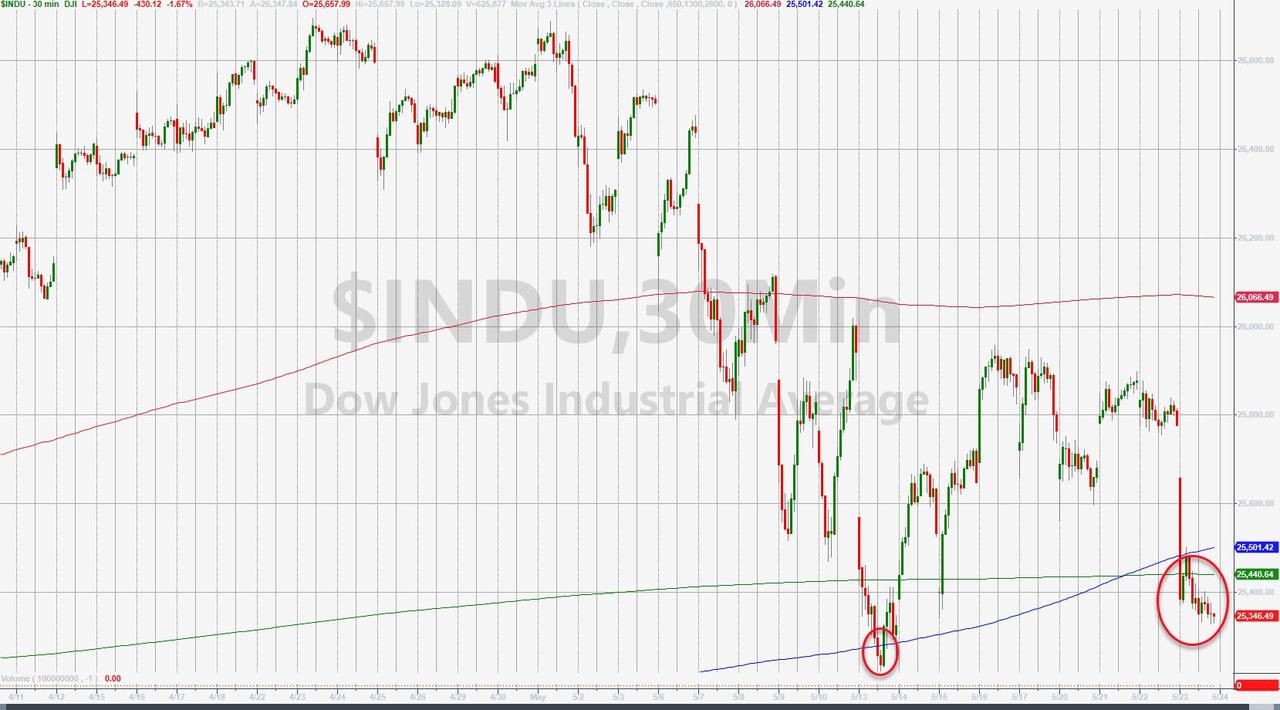
There was nothing for the computer algos to be optimistic about, as far as uplifting news headlines was concerned. There simply weren’t any, and the Dow started the session with a 400-point drop and ended up below its 200-day M/A for the first time since the beginning of the year.
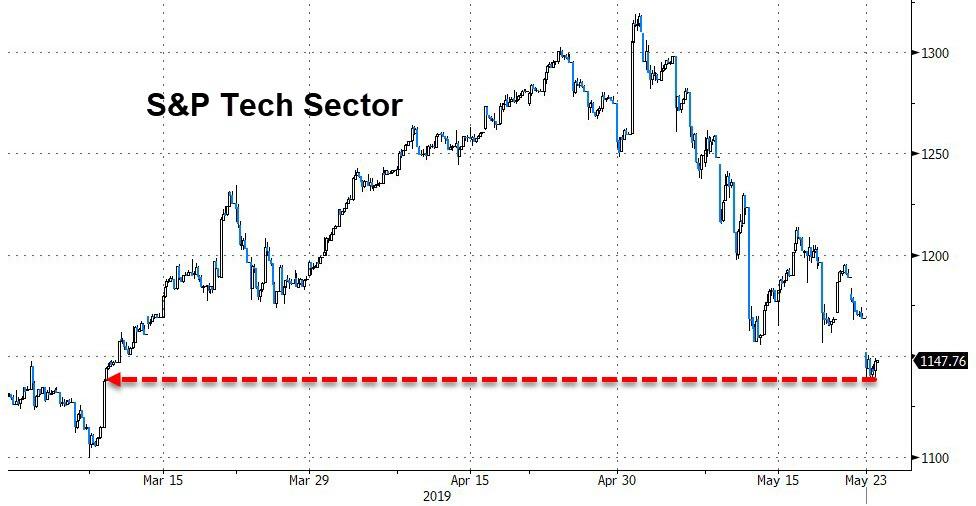
Even a hint of a rebound was quickly wiped out, as traders worldwide seemed to have finally gotten the idea that the widely touted trade deal had bitten the dust, and a protracted U.S.-China confrontation has morphed into a lengthy standoff. These increased frictions weighed heavily on the markets in general and on the tech sector specifically.
The jawboning between the countries went on with China stating the talks would only continue when the U.S. adjusts its “wrong actions,” etc., etc., etc. with the tit-for-tat sinking to new lows.
None of this helped equities, which were struck be several economic data misses. New home sales collapsed in April, despite a soaring median price, even though they were expected to slide only -2.5% but instead plunged -6.9% MoM after an upward revision for March.
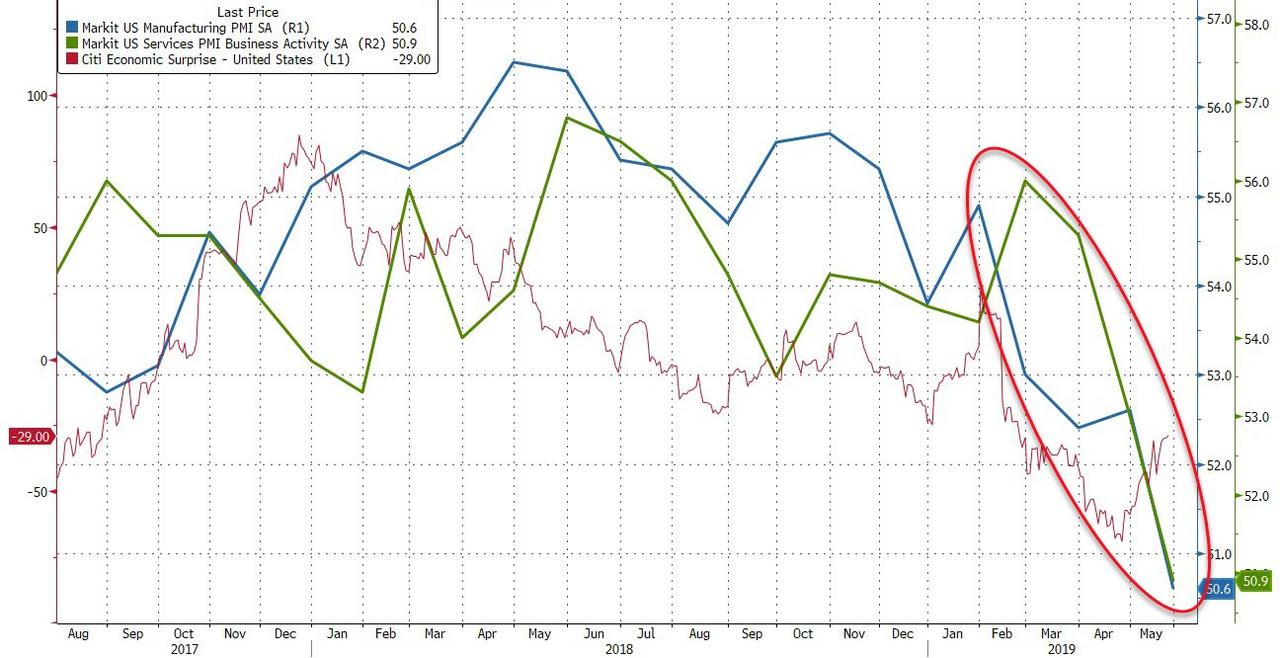
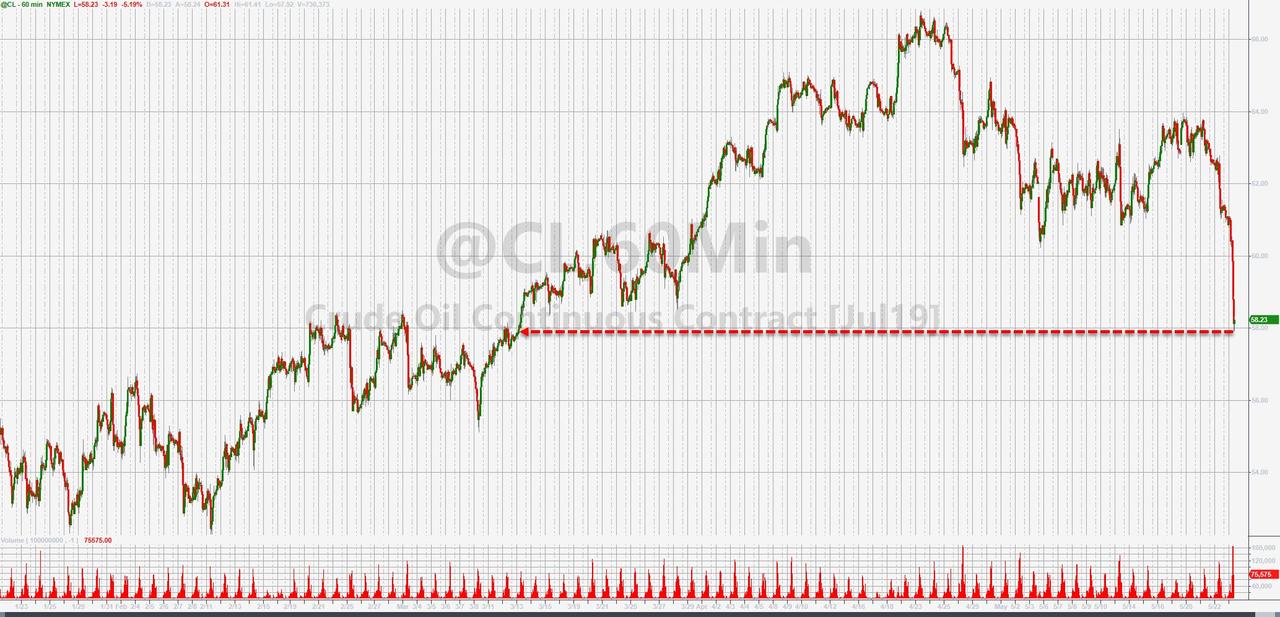
Business Confidence followed suit by tumbling to 7-year lows, while Crude Oil crashed to 2-month lows, likely as a result of trade tensions reducing hope for a revival of global growth.
The bond market was in panic mode, as yields plummeted with the 10-year touching 2.29%, the lowest since December 2017, as traders moved out of equities and into the perceived safety of bonds.
During the last 30 minutes of trading, some dip buyers showed up to pull the indexes off their lows, but it was not enough to affect the sea of red we witnessed all day.
2. ETFs in the Spotlight
In case you missed the announcement and description of this section, you can read it here again.
It features 10 broadly diversified and sector ETFs from my HighVolume list as posted every Saturday. Furthermore, they are screened for the lowest MaxDD% number meaning they have been showing better resistance to temporary sell offs than all others over the past year.
The below table simply demonstrates the magnitude with which some of the ETFs are fluctuating regarding their positions above or below their respective individual trend lines (%+/-M/A). A break below, represented by a negative number, shows weakness, while a break above, represented by a positive percentage, shows strength.
For hundreds of ETF choices, be sure to reference Thursday’s StatSheet.
For this current domestic “Buy” cycle, here’s how some our candidates have fared:
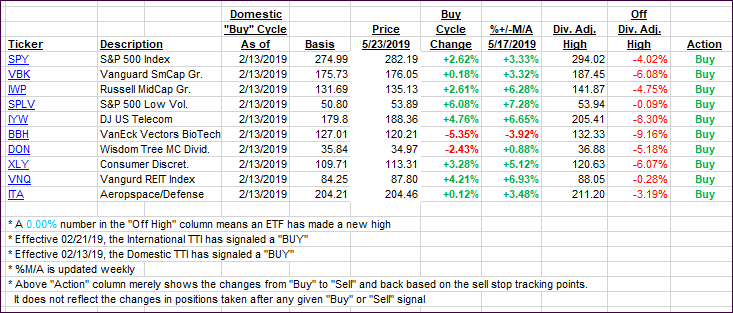
Again, the %+/-M/A column above shows the position of the various ETFs in relation to their respective long-term trend lines, while the trailing sell stops are being tracked in the “Off High” column. The “Action” column will signal a “Sell” once the -8% point has been taken out in the “Off High” column. For more volatile sector ETFs, the trigger point is -10%.
3. Trend Tracking Indexes (TTIs)
Our Trend Tracking Indexes (TTIs) dove, with the International one again breaking its trend line to the downside. I will wait for more confirmation before declaring this ‘Buy’ cycle to be over.
Here’s how we closed 05/23/2019:
Domestic TTI: +1.80% above its M/A (last close +3.08%)—Buy signal effective 02/13/2019
International TTI: -0.97% below its M/A (last close +0.16%)—Buy signal effective 02/21/2019
Disclosure: I am obliged to inform you that I, as well as my advisory clients, own some of the ETFs listed in the above table. Furthermore, they do not represent a specific investment recommendation for you, they merely show which ETFs from the universe I track are falling within the specified guidelines.
Contact Ulli