
ETF Tracker StatSheet
You can view the latest version here.
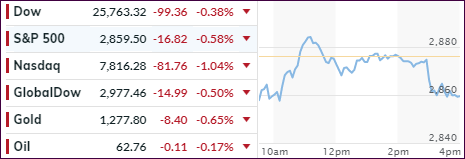
ENDING THE WEEK ON A SOUR NOTE
- Moving the markets
The struggle for direction shifted into high gear when, after a weak opening, the algos pushed the indexes back into the green, only to see the gains disappear in a sudden late session sell off. In between, the S&P 500 vacillated tightly around its unchanged line.
ZH described the cause of the early dump and the late slump very concisely:
…the reason why futures slumped overnight is because Chinese officials turned up the trade war rhetoric, warning that there are no plans for another round of talks. Additionally, front page commentary in the Communist Party’s People’s Daily evoked the patriotic spirit of past wars, saying the trade war would never bring China down, while commentary on the blog Taoran Notes, which was carried by state-run Xinhua, accused the U.S. of “playing tricks to disrupt the atmosphere.”
The message was clear: no talks are scheduled, and more importantly, China has no urge to schedule talks in the immediate future or to engage the “barbarian” Trump.
And so, with exactly one hour in trading left, CNBC doubled down, reporting what traders already knew thanks to the latest round of belligerent Chinese rhetoric, namely that “negotiations between the US and China appear to have stalled as both sides dig in after disagreement earlier this month.” Additionally, CNBC also echoed what Chinese officials had already said, and citing two sources briefed on the status of the talks, said that scheduling for the next round of negotiations is “in flux” because it is unclear what the two sides would negotiate.
Finally, pointing out the obvious, CNBC notes that “China has not signaled it is willing to revisit past promises on which it reneged earlier this month, despite showing up for talks in Washington last week.”
The market reaction was instantaneous and negative, sending the S&P sharply lower… and yet prompting questions: why is the market sharply lower on “news” which everyone already knew? Perhaps the biggest question is just what idiot is the marginal price setter in a market, in which nearly day-old news can hammer stocks not once but twice, and linked to that, just how dumb are the algos?
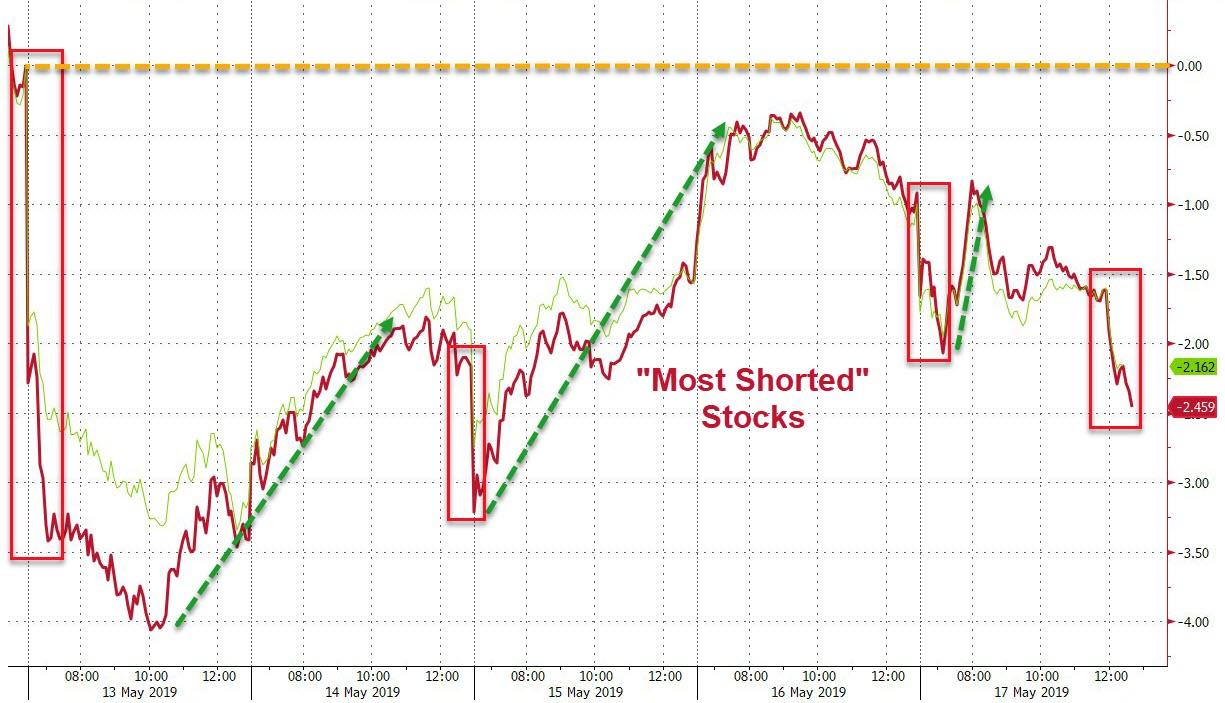
As a result, the Dow is down four weeks in a row, something we have not seen since May 2016. Also, the mid-week short-squeeze ran out of juice today causing the major indexes to end this week on a sour note.
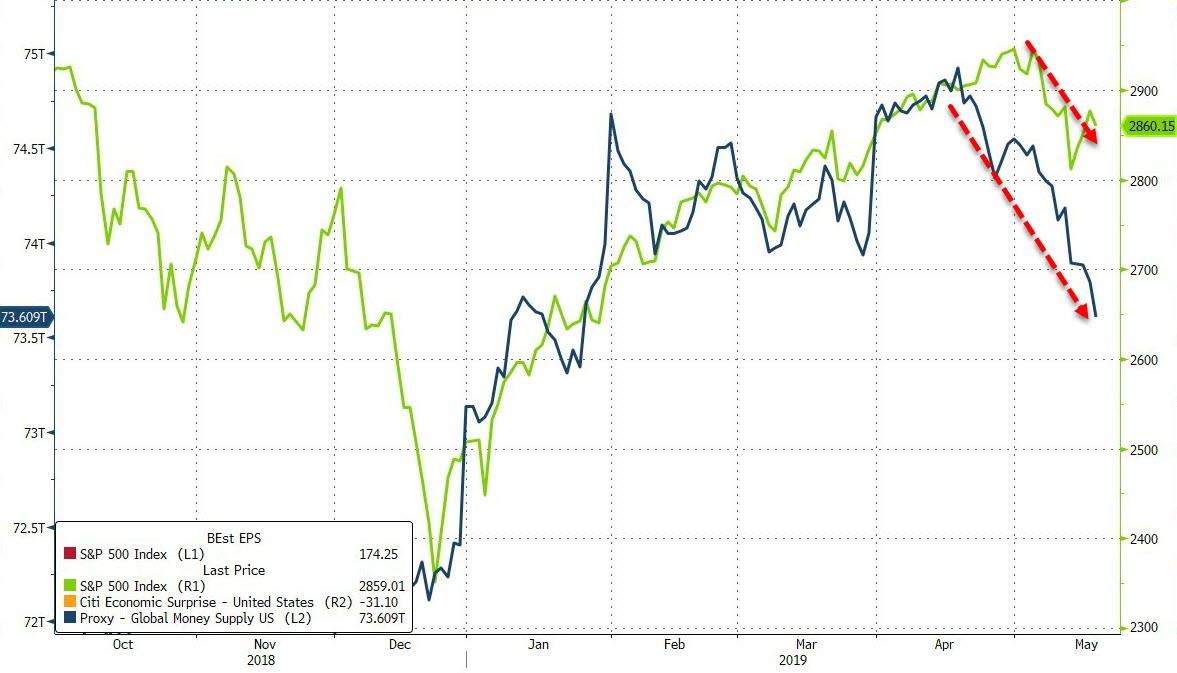
With the U.S.-China trade talks having collapsed, a new driver is needed to prop up the markets next week. Otherwise, the downside may come into play again and, as I posted before, collapsing global money supply will currently not be of any assistance to the bullish theme.
2. ETFs in the Spotlight
In case you missed the announcement and description of this section, you can read it here again.
It features 10 broadly diversified and sector ETFs from my HighVolume list as posted every Saturday. Furthermore, they are screened for the lowest MaxDD% number meaning they have been showing better resistance to temporary sell offs than all others over the past year.
The below table simply demonstrates the magnitude with which some of the ETFs are fluctuating regarding their positions above or below their respective individual trend lines (%+/-M/A). A break below, represented by a negative number, shows weakness, while a break above, represented by a positive percentage, shows strength.
For hundreds of ETF choices, be sure to reference Thursday’s StatSheet.
For this current domestic “Buy” cycle, here’s how some our candidates have fared:

Again, the %+/-M/A column above shows the position of the various ETFs in relation to their respective long-term trend lines, while the trailing sell stops are being tracked in the “Off High” column. The “Action” column will signal a “Sell” once the -8% point has been taken out in the “Off High” column. For more volatile sector ETFs, the trigger point is -10%.
3. Trend Tracking Indexes (TTIs)
Our Trend Tracking Indexes (TTIs) pulled back as the markets ended up in the red for the session.
Here’s how we closed 05/17/2019:
Domestic TTI: +3.15% above its M/A (last close +3.86%)—Buy signal effective 02/13/2019
International TTI: +0.35% above its M/A (last close +0.81%)—Buy signal effective 02/21/2019
Disclosure: I am obliged to inform you that I, as well as my advisory clients, own some of the ETFs listed in the above table. Furthermore, they do not represent a specific investment recommendation for you, they merely show which ETFs from the universe I track are falling within the specified guidelines.
———————————————————-
WOULD YOU LIKE TO HAVE YOUR INVESTMENTS PROFESSIONALLY MANAGED?
Do you have the time to follow our investment plans yourself? If you are a busy professional who would like to have his portfolio managed using our methodology, please contact me directly or get more details here.
———————————————————
Back issues of the ETF/No Load Fund Tracker are available on the web.
Contact Ulli