
- Moving the markets
Volatility returned with a vengeance, as uncertainty about the U.S.-China trade talks ratcheted up a notch, despite Vice Premier Liu He’s intention to attend trade talks this week in Washington.
However, that did nothing to soothe nervous traders on Wall Street, who concluded that no resolution would materialize by Friday, the day on which the import duties for Chinese goods would be hiked substantially. To save the markets from further destruction, it would not surprise me if the tariff deadline will be postponed, say on Thursday prior to the close.
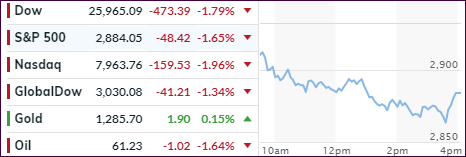
The bears took over, and the selling accelerated throughout the session with the Dow being down around 600 points at one time. Luckily, buyers appeared during the last 30 minutes and erased some the of the losses. However, the major indexes tumbled in unison, with the S&P 500 improving the most during the late session rebound.
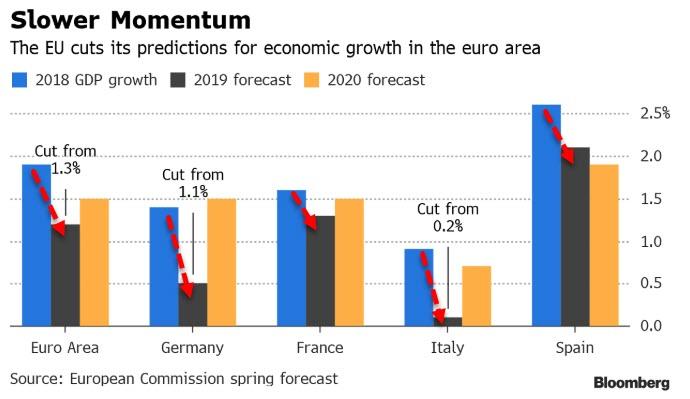
Contributing to the sour sentiment was the EU, which slashed their growth outlook for the region, as this chart shows. Maybe we are finally seeing some reality creeping into the prior hope-filled economic forecasts. After all, you can only put so much lipstick on a pig…
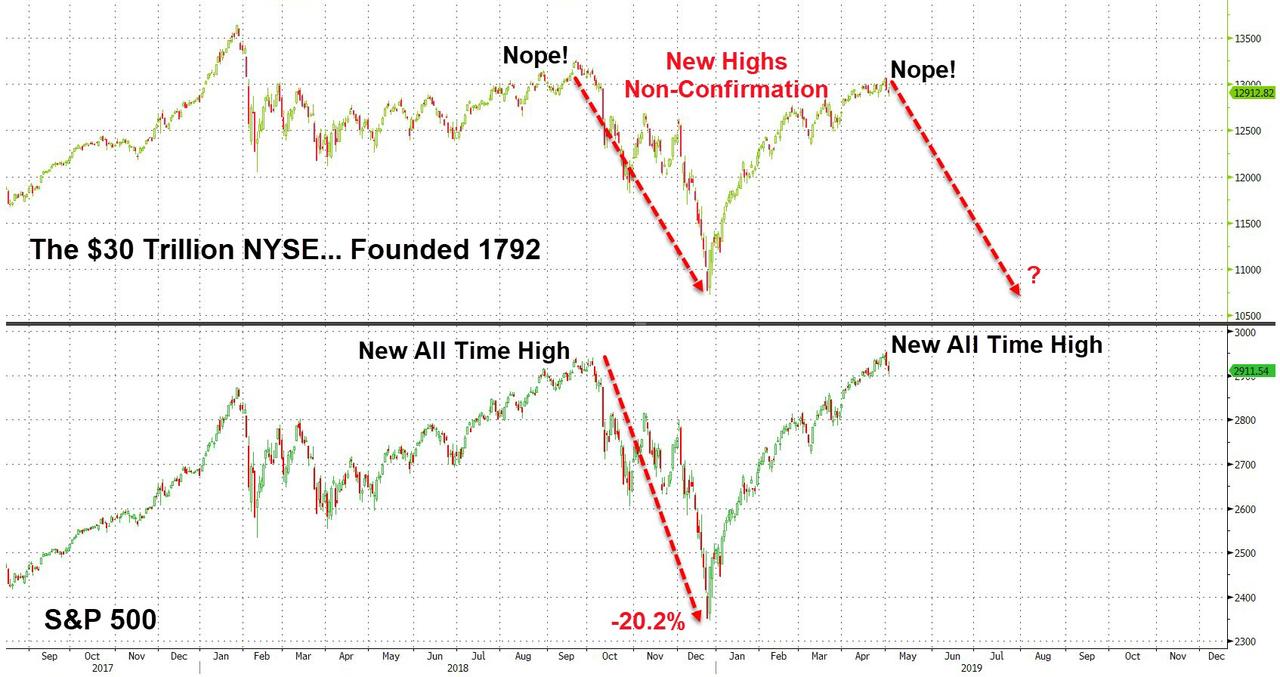
Again, it pays to look at this graph portraying the NYSE index, the world’s largest, which is flashing a divergence to the S&P 500. It shows that for the second time the S&P 500 has made a new all-time high, and the NYSE index did follow suit. You can see what subsequently happened last summer when the S&P took a 20% dive.
Right now, it looks to be an almost identical set up, which presents the question “will it be different this time?” Since no one has that answer, we will have to wait and see how things will play out.
Despite today’s equity dump, our Trend Tracking strategy was not affected, nor did any sell stops get triggered.
2. ETFs in the Spotlight
In case you missed the announcement and description of this section, you can read it here again.
It features 10 broadly diversified and sector ETFs from my HighVolume list as posted every Saturday. Furthermore, they are screened for the lowest MaxDD% number meaning they have been showing better resistance to temporary sell offs than all others over the past year.
The below table simply demonstrates the magnitude with which some of the ETFs are fluctuating regarding their positions above or below their respective individual trend lines (%+/-M/A). A break below, represented by a negative number, shows weakness, while a break above, represented by a positive percentage, shows strength.
For hundreds of ETF choices, be sure to reference Thursday’s StatSheet.
For this current domestic “Buy” cycle, here’s how some our candidates have fared:
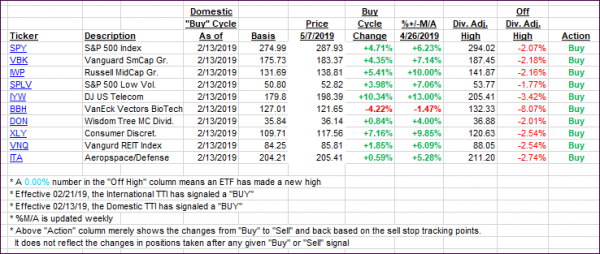
Again, the %+/-M/A column above shows the position of the various ETFs in relation to their respective long-term trend lines, while the trailing sell stops are being tracked in the “Off High” column. The “Action” column will signal a “Sell” once the -8% point has been taken out in the “Off High” column. For more volatile sector ETFs, the trigger point is -10%.
3. Trend Tracking Indexes (TTIs)
Our Trend Tracking Indexes (TTIs) headed south as the bears ruled this session, but our indicators remain in bullish territory.
Here’s how we closed 05/07/2019:
Domestic TTI: +4.35% above its M/A (last close +6.05%)—Buy signal effective 02/13/2019
International TTI: +2.04% above its M/A (last close +3.43%)—Buy signal effective 02/21/2019
Disclosure: I am obliged to inform you that I, as well as my advisory clients, own some of the ETFs listed in the above table. Furthermore, they do not represent a specific investment recommendation for you, they merely show which ETFs from the universe I track are falling within the specified guidelines.
Contact Ulli