
- Moving the markets
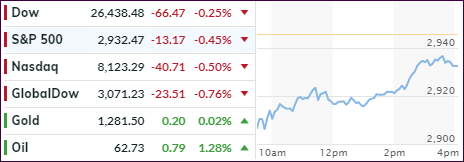
The futures market was hit hard last night with the Dow being down some 500 points, while the S&P 500 got hammered at the tune of -2.4%. By the time, the regular session opened, some of these losses had already been made up, and we started the day with the Dow in the red by ‘only’ 300 points.
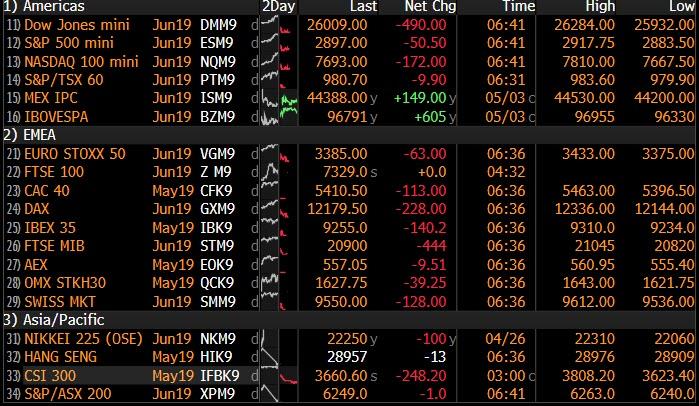
Global stocks crashed as well, all in reaction Trump’s announcement that the U.S.-China trade deal was not only not going “optimistically” but had effectively collapsed, and tariffs on $200 billion of Chinese imports would be hiked to 25%.
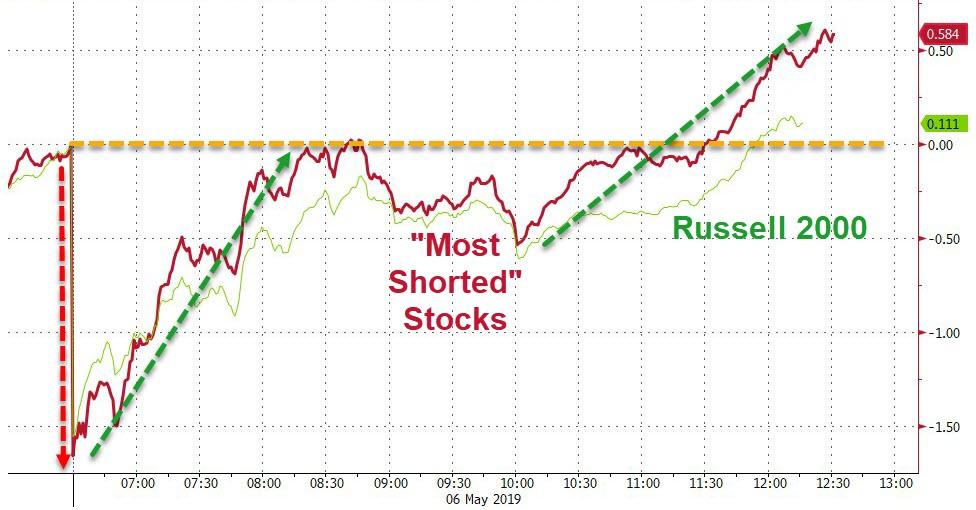
The result was a sea of red in just about all markets overnight, but things calmed down as today’s session got underway with a magical comeback in the making, severely cutting down the losses which, at the end, were barely noteworthy.
Helping the recovery was a giant short squeeze and most likely strong buying power generated via the Plunge Protection Team (PPT). Helping to ramp the markets higher was sudden news that China would send a smaller delegation to Washington rather than the 100-person group originally scheduled. Of course, whether this group will talk or simply sightsee remains to be seen.
While this movie may not be over, for right now at least, no damage has been done regarding major trend direction.
2. ETFs in the Spotlight
In case you missed the announcement and description of this section, you can read it here again.
It features 10 broadly diversified and sector ETFs from my HighVolume list as posted every Saturday. Furthermore, they are screened for the lowest MaxDD% number meaning they have been showing better resistance to temporary sell offs than all others over the past year.
The below table simply demonstrates the magnitude with which some of the ETFs are fluctuating regarding their positions above or below their respective individual trend lines (%+/-M/A). A break below, represented by a negative number, shows weakness, while a break above, represented by a positive percentage, shows strength.
For hundreds of ETF choices, be sure to reference Thursday’s StatSheet.
For this current domestic “Buy” cycle, here’s how some our candidates have fared:
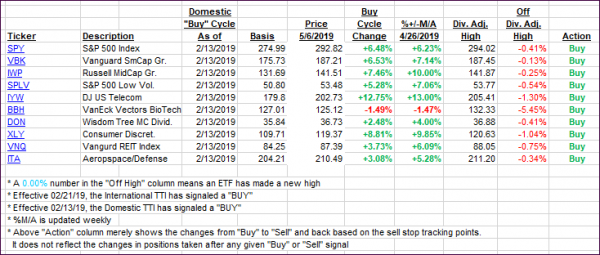
Again, the %+/-M/A column above shows the position of the various ETFs in relation to their respective long-term trend lines, while the trailing sell stops are being tracked in the “Off High” column. The “Action” column will signal a “Sell” once the -8% point has been taken out in the “Off High” column. For more volatile sector ETFs, the trigger point is -10%.
3. Trend Tracking Indexes (TTIs)
Our Trend Tracking Indexes (TTIs) both dropped with the International one showing far more weakness.
Here’s how we closed 05/06/2019:
Domestic TTI: +6.05% above its M/A (last close +6.56%)—Buy signal effective 02/13/2019
International TTI: +3.43% above its M/A (last close +4.22%)—Buy signal effective 02/21/2019
Disclosure: I am obliged to inform you that I, as well as my advisory clients, own some of the ETFs listed in the above table. Furthermore, they do not represent a specific investment recommendation for you, they merely show which ETFs from the universe I track are falling within the specified guidelines.
Contact Ulli