
- Moving the markets
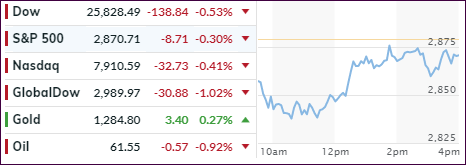
Another jaw dropping opening had the Dow down some 400 points early in the day, as anxiety increased over the deepening trade dispute with China, which continued to squash any bullish sentiment not just here in the U.S. but globally as well.
Wall Street traders tend to operate by the well-known adage “by the rumor, sell the fact,” but all week it has been almost impossible to figure out what is the rumor and what is the fact in the ever worsening U.S.-China trade tug-of-war.
Today was no exception, but to stop the markets from accelerating their plunge, Trump came out mid-day and jawboned that “a trade deal this week is still possible, but he has an ‘excellent alternative’ to the China deal.”
That pulled the markets out of their doldrums and got the rescue rebound started, causing ZeroHedge to tweet Trump’s new strategy (tongue-in-cheek, of course):
White House new trading strategy: deny trade deal is dead during US hours sending US stocks higher, confirm no deal ahead of China open crashing Shanghai Composite.
Not helping the mood of the warring trade parties was news that the FCC had barred China Mobile from providing telecom services in the U.S. market—over espionage concerns.
In the end, the major indexes cut down their early losses substantially, but I must wonder if this is just a temporary halt on the way towards a new visit in bear market territory.
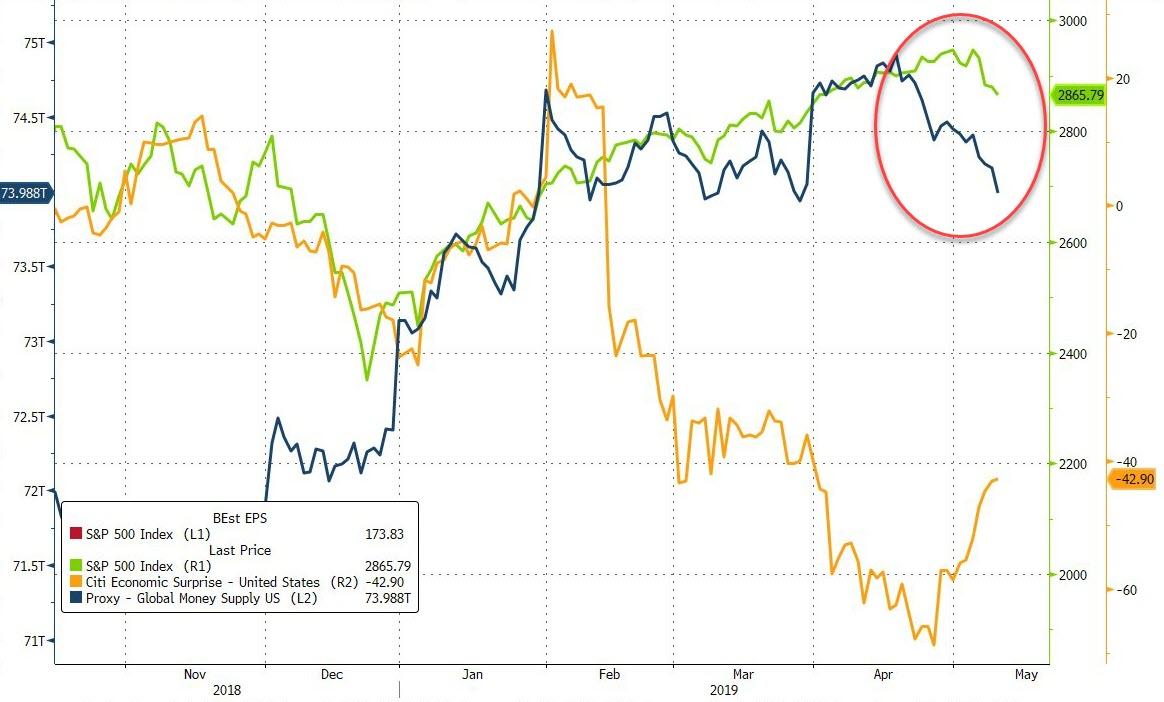
I have on several occasions posted this chart showing the effect global money supply (blue line) has had on the direction of equities (S&P 500 green line).
In today’s update, the money supply has clearly rolled over begging the question “will the S&P 500 follow?”
2. ETFs in the Spotlight
In case you missed the announcement and description of this section, you can read it here again.
It features 10 broadly diversified and sector ETFs from my HighVolume list as posted every Saturday. Furthermore, they are screened for the lowest MaxDD% number meaning they have been showing better resistance to temporary sell offs than all others over the past year.
The below table simply demonstrates the magnitude with which some of the ETFs are fluctuating regarding their positions above or below their respective individual trend lines (%+/-M/A). A break below, represented by a negative number, shows weakness, while a break above, represented by a positive percentage, shows strength.
For hundreds of ETF choices, be sure to reference Thursday’s StatSheet.
For this current domestic “Buy” cycle, here’s how some our candidates have fared:
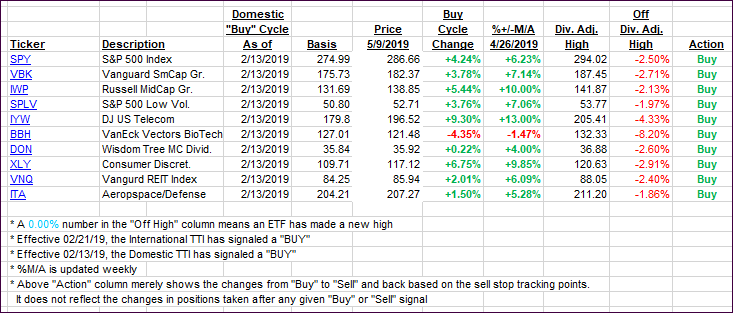
Again, the %+/-M/A column above shows the position of the various ETFs in relation to their respective long-term trend lines, while the trailing sell stops are being tracked in the “Off High” column. The “Action” column will signal a “Sell” once the -8% point has been taken out in the “Off High” column. For more volatile sector ETFs, the trigger point is -10%.
3. Trend Tracking Indexes (TTIs)
Our Trend Tracking Indexes (TTIs) slipped with the International one showing far more weakness by diving towards its trend line. For right now, however, it still remains positive.
Here’s how we closed 05/09/2019:
Domestic TTI: +4.05% above its M/A (last close +4.18%)—Buy signal effective 02/13/2019
International TTI: +0.68% above its M/A (last close +1.69%)—Buy signal effective 02/21/2019
Disclosure: I am obliged to inform you that I, as well as my advisory clients, own some of the ETFs listed in the above table. Furthermore, they do not represent a specific investment recommendation for you, they merely show which ETFs from the universe I track are falling within the specified guidelines.
Contact Ulli